
How to Tune Concurrency in Apache Airflow
Apache Airflow concurrency settings control how many tasks or workflows can run simultaneously. Proper tuning ensures efficient resource use, avoids bottlenecks, and prevents overloading external systems.
Key Takeaways:
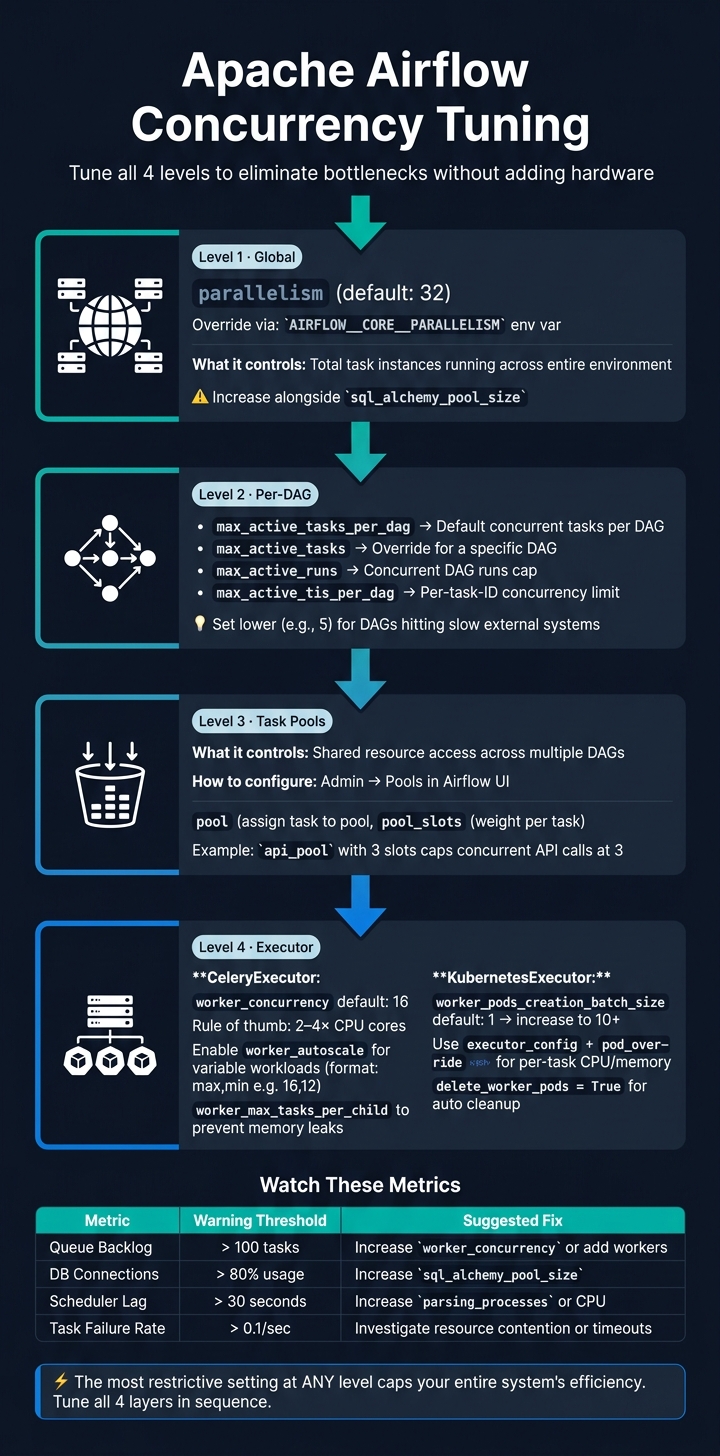
- Concurrency Levels: Airflow manages concurrency at four levels - global, DAG, task, and executor.
- Global (
parallelism): Limits tasks running across the entire setup. - Per-DAG (
max_active_tasks_per_dag): Caps tasks within a single DAG. - Task Pools: Control shared resource access.
- Executor (
worker_concurrency): Manages tasks per worker.
- Global (
- Identifying Bottlenecks:
- Monitor metrics like
queued_tasks,executor.open_slots, anddagrun.schedule_delay. - Check logs for scheduler lag or database saturation.
- Monitor metrics like
- Tuning Steps:
- Start with global settings (
parallelism). - Adjust DAG-specific limits to prevent one DAG from monopolizing resources.
- Use task pools to manage shared external resource usage.
- Optimize executor settings (e.g.,
worker_concurrencyfor Celery orworker_pods_creation_batch_sizefor Kubernetes).
- Start with global settings (
- Best Practices:
- Use monitoring tools like Datadog or Prometheus.
- Test changes incrementally and track metrics.
- Design efficient DAGs by avoiding heavy operations outside tasks. For those looking to master data engineering and advanced workflow orchestration, professional certification can provide deeper architectural insights.
By systematically addressing each layer - global, DAG, task, and executor - you can improve Airflow performance without adding unnecessary hardware or resources.
Apache Airflow Concurrency Tuning: 4-Level Framework
Analyzing Your Current Airflow Setup
Identifying Concurrency Bottlenecks
One way to spot concurrency issues is by noticing tasks stuck in the "scheduled" or "queued" states longer than they should be. If you see high numbers on your queued task charts, it’s a clear sign that your system is struggling to keep up with the workload.
Your worker logs can also reveal a lot. Look for entries like "Received SIGTERM", "Warm shutdown", or "State of this instance has been externally set to success". These messages often indicate that resource limits are being hit, causing workers to restart. On the scheduler side, a warning like "The scheduler does not appear to be running" in the Web UI usually means the scheduler is overwhelmed and missing heartbeats. If you’re also seeing psycopg2.OperationalError in your logs, it’s likely that your metadata database has too many concurrent connections and is becoming saturated.
Sometimes, tasks remain in the "scheduled" state not because of worker resource shortages but because the assigned pool slots are all taken. By keeping an eye on these symptoms through logs and metrics, you can better understand the root cause of the bottlenecks.
Using Metrics and Logs for Diagnostics
Airflow provides a range of metrics to help you diagnose performance issues and fine-tune your configurations. Here are some of the most useful ones:
| Metric Name | Type | What It Tells You |
|---|---|---|
executor.open_slots |
Gauge | Available capacity in the executor |
executor.queued_tasks |
Gauge | Number of tasks waiting to be picked up |
scheduler.tasks.starving |
Gauge | Tasks blocked due to unavailable pool slots |
task.queued_duration |
Timer | Time a task spends in the queue before starting |
dag_processing.total_parse_time |
Gauge | Time taken to scan and import all DAG files |
dagrun.schedule_delay |
Timer | Delay between scheduled start and actual start |
For extended monitoring, tools like Datadog, Prometheus, or AWS CloudWatch can provide historical trends and real-time alerts that go beyond what the Airflow UI offers. Pay close attention to metrics like scheduler_heartbeat and triggerer_heartbeat. A drop in their frequency is an early indicator that a component might be under strain.
Additionally, the command airflow dags report from the CLI can help you check how long it takes to parse your DAGs. If parsing times are high, it could mean that complex DAG code is eating up scheduler capacity.
Setting a Baseline Before Tuning
After identifying bottlenecks, it’s essential to document your current settings and performance metrics. This step ensures that any tuning efforts are informed and measurable. As the AWS Big Data Blog explains:
"Performance issues often resemble resource exhaustion, but actually derive from overly restrictive configurations."
Without a proper baseline, you might waste resources, like adding more workers, when the real issue lies in your configuration. Use the airflow config get-value command to note your current settings for parameters like parallelism, max_active_tasks_per_dag, and max_active_runs_per_dag. Also, check your worker_concurrency setting and confirm that your dag_dir_list_interval isn’t shorter than the time it takes to parse your DAGs by reviewing the dag_processing.total_parse_time metric.
During peak usage, monitor worker CPU and memory usage with a 1-minute window, focusing on "Maximum" statistics to capture spikes. Combine this infrastructure data with your queue depths and recorded settings to create a clear snapshot of your system’s performance. This baseline will serve as the foundation for validating any improvements you make.
sbb-itb-61a6e59
Tuning Global and DAG-Level Concurrency
Adjusting Deployment-Level Concurrency
Once you've analyzed your system's performance, the next step is to adjust global and DAG-level concurrency settings to ensure tasks are executed efficiently across your Airflow setup.
The parallelism value in the [core] section of airflow.cfg is your go-to setting for managing deployment-level concurrency. This parameter limits the total number of task instances that can run at the same time across the entire environment. The default value is 32, which might not be enough for production workloads.
If you're running Airflow in a containerized environment, you can override the file-based configuration using the AIRFLOW__CORE__PARALLELISM environment variable. As you increase parallelism, keep an eye on the sql_alchemy_pool_size setting under [database] to ensure your database can handle the additional load. Another key setting, scheduler.max_tis_per_query, should be set lower than core.parallelism to keep the scheduler's query loop from becoming a bottleneck.
After configuring global concurrency, focus on fine-tuning individual DAGs to prevent resource hogging by any single workflow.
Tuning DAG-Level Concurrency
Even with a high global parallelism value, a single intensive DAG can consume all available slots, leaving other workflows in the queue. To avoid this, you can set limits specific to each DAG.
Here are some key parameters to adjust:
| Parameter | Where It's Set | What It Controls |
|---|---|---|
max_active_tasks_per_dag |
airflow.cfg / env var |
Default limit on the number of concurrent tasks for any DAG |
max_active_tasks |
DAG code | Overrides the default limit for a specific DAG |
max_active_runs |
DAG code | Caps the number of concurrent runs for a particular DAG |
max_active_tis_per_dag |
Task code | Limits the number of concurrent instances for a specific task ID |
Settings defined in the DAG code will override global defaults. For instance, if you have a lightweight ETL DAG, you might set max_active_tasks=30 to allow up to 30 tasks to run simultaneously. On the other hand, if a DAG interacts with a slower external system, setting this value to around 5 can help prevent resource strain.
The max_active_tis_per_dag parameter is especially handy when you need to restrict the number of concurrent instances for a specific task. For example, if a task involves exporting files, you might set this limit to ensure only a few instances run at the same time across all DAG runs.
Once you've configured DAG-level limits, consider using pools to manage shared external resources effectively.
Using Pools to Control Shared Resource Access
Pools are an excellent way to manage concurrency across multiple DAGs that rely on the same external resource. While DAG-level limits help within individual workflows, pools ensure that resources shared by multiple DAGs don't become overburdened.
To create a pool, go to Admin → Pools in the Airflow UI. Click the + button, assign a name to the pool (e.g., snowflake_pool), and set the number of slots to match the capacity of the external system. Then, assign tasks to the pool using the pool parameter in the task's operator.
For example, Astronomer shared a case where a pool named api_pool was created with 3 slots to limit API calls. Tasks from different DAGs were assigned varying priority_weight values, ensuring critical tasks were executed first. This setup effectively capped concurrent API calls at 3.
For resource-heavy tasks, such as a full-table database backup compared to a simple row count, you can use the pool_slots parameter to allocate more slots per task, reflecting its actual resource needs. Also, double-check that the pool name used in your DAG code matches an existing pool in the UI - tasks assigned to non-existent pools won't be scheduled.
Tuning Executor and Worker Concurrency
Tuning CeleryExecutor Settings
For those using CeleryExecutor, the worker_concurrency setting in the [celery] section is key. This parameter determines how many task instances a single worker can manage simultaneously, with the default set to 16. A good rule of thumb is to set worker_concurrency to 2–4 times the number of CPU cores. Increase it for I/O-heavy tasks, but reduce it for CPU-intensive workloads. However, setting this value too high can interfere with autoscaling since the task queue might not fill up enough to trigger the need for new workers.
If your workload varies, enabling worker_autoscale can be a game-changer. This setting uses a max,min format (e.g., 16,12) to dynamically adjust the worker's process pool based on demand. This can help reduce task latency and improve throughput. To address potential memory leaks in long-running workers, configure the worker_max_tasks_per_child setting, which restarts a worker process after it has completed a specified number of tasks.
For task acknowledgment, set task_acks_late=True to ensure tasks are acknowledged only after completion. Also, make sure your visibility_timeout exceeds the duration of your longest task. By default, Redis and SQS brokers have a visibility_timeout of 86,400 seconds (24 hours).
Configuring KubernetesExecutor for Better Performance
If you're using KubernetesExecutor, it offers unique advantages, such as launching each task in its own pod for better isolation. However, this comes with added scheduling overhead. A critical setting here is worker_pods_creation_batch_size, which defaults to 1. This means only one pod is created per scheduler heartbeat. To boost concurrency, increase this value to 10 or higher, depending on your cluster's capacity.
KubernetesExecutor also allows per-task resource customization. Using executor_config with a pod_override, you can assign specific CPU and memory limits to individual tasks. This ensures that resource-intensive tasks don't monopolize resources, leaving lighter tasks stuck in the queue. For environments with namespace-level resource quotas, enabling multi_namespace_mode can distribute worker pods across multiple Kubernetes namespaces, helping you stay within API limits.
Pod startup delays can also impact performance. If tasks linger in a "queued" state for 60–120 seconds, the delay is often due to pod initialization - especially when dependencies are installed via pip install during runtime. To minimize this, pre-build dependencies into a custom Docker image. Additionally, setting delete_worker_pods = True ensures that finished pods are automatically cleaned up, reducing unnecessary load on the Kubernetes API server.
Improving Scheduler Performance
Once you've optimized worker settings, turn your attention to the scheduler to handle high concurrency more effectively. Two settings can significantly improve performance at scale. First, increase min_file_process_interval and set parsing_processes to twice the number of available vCPUs. This reduces CPU usage while managing numerous DAG files.
If your metadata database is under heavy load, consider increasing scheduler_heartbeat_sec from its default of 5 seconds to 15 seconds or more. This reduces the frequency of database writes. Similarly, raising job_heartbeat_sec to 30 seconds or more can give the database additional breathing room.
Testing Changes and Long-Term Best Practices
Making Incremental Changes and Monitoring Results
Tweak one setting at a time. For example, adjust a single parameter like worker_concurrency or parallelism, then monitor its impact on metrics such as queue times, CPU usage, and scheduler lag. Changing multiple settings at once makes it hard to pinpoint what actually improved performance.
Here are some key thresholds to watch out for:
| Metric | Warning Threshold | Suggested Fix |
|---|---|---|
| Queue Backlog | > 100 tasks | Increase worker_concurrency or add workers |
| DB Connections | > 80% usage | Increase sql_alchemy_pool_size |
| Scheduler Lag | > 30 seconds | Increase parsing_processes or CPU |
| Task Failure Rate | > 0.1/sec | Investigate resource contention or timeouts |
Keep an eye on metrics like executor.queued_tasks to measure task backlog, dagrun.schedule_delay for scheduling delays, and database connection pool usage. If database connections exceed 80%, you're likely heading toward scheduler lag or metadata database saturation. Similarly, a task failure rate above 0.1/sec signals the need for immediate troubleshooting.
A practical way to test changes is by using Canary DAGs. These are lightweight DAGs that run on a fixed schedule, helping you monitor connections and external system health. They provide a consistent baseline for normal execution times, making it easier to detect performance issues after a configuration update.
After testing and monitoring, focus on refining your DAG design to further optimize performance.
Improving DAG Design for Better Concurrency
Well-designed DAGs can significantly improve concurrency. For instance, avoid placing heavy operations like database queries, Variable.get() calls, or large imports outside of task functions. When these are in top-level Python code, they run every time the DAG processor parses the file, adding unnecessary load to the scheduler. Instead, move such logic inside task functions.
Another common pitfall is using datetime.now() for a DAG’s start_date. This can cause issues with proper scheduling, so it’s better to use a fixed date instead. For DAGs that don’t require historical backfills, set catchup=False to prevent a flood of active runs when the DAG is first enabled. Additionally, if you’re using sensors to poll external systems, enabling deferrable=True allows workers to free up slots while waiting, improving overall throughput without needing extra resources.
By keeping these design principles in mind, you can ensure your DAGs run efficiently and avoid unnecessary bottlenecks.
Making Concurrency Reviews Part of Routine Operations
"Scaling your Airflow environment is an art and not a science, and it's highly dependent on your supporting infrastructure and your DAGs." - Astronomer
What works for your Airflow setup today might not work six months down the line as workloads change. Regular reviews of both configuration metrics and DAG design are essential to maintaining efficiency. Monitor metrics like queue depth, scheduler heartbeat, and worker utilization consistently - not just when issues arise. Schedule intensive tasks like backfills or major tuning during maintenance windows to minimize disruptions.
On the database side, running regular VACUUM operations on your PostgreSQL metadata database helps clear out dead tuples that build up during high-concurrency periods. Also, if you upgrade to a larger environment class, such as moving from a small to medium instance, manually revisit settings like celery.worker_autoscale. These don’t always adjust automatically to reflect new resource limits.
A deep dive into Airflow configuration options for scalability
Conclusion
Adjusting Airflow concurrency settings is an ongoing process that demands careful monitoring and thoughtful tweaks. Before investing in more hardware, check if your configuration is the bottleneck. Defaults like parallelism = 32 or max_active_tasks_per_dag = 16 can cause workers to sit idle while queued tasks grow.
To maximize performance, focus on four key levels: environment, global Airflow settings, DAG, and task. The most restrictive setting at any of these levels will ultimately cap your system’s efficiency. Using tools like pools, deferrable operators, and writing efficient DAG code can significantly increase throughput - often without needing extra servers. By addressing each layer, you can ensure your setup works in harmony for better performance.
"Scaling Airflow is about identifying and removing bottlenecks systematically. Start with the scheduler and database, then scale workers horizontally." - Nawaz Dhandala, OneUptime
Implementing changes should be done gradually. Make small adjustments and observe production performance over 24–48 hours to confirm improvements. Keep in mind that configurations tested in staging may behave differently when subjected to real-world production loads.
For more hands-on learning, check out DataExpert.io Academy. Their boot camps cover everything from pipeline design to orchestration tools like Databricks, Snowflake, and AWS, helping you sharpen your data engineering expertise.
FAQs
Which Airflow setting is limiting my runs right now?
To figure out what's holding back your runs, take a closer look at these important settings:
- max_active_runs: This controls how many DAG runs can happen at the same time. If the limit is hit, no new DAG runs will start.
- max_active_tasks_per_dag: Sets a cap on how many tasks can run simultaneously within a single DAG.
- Pool size: Determines the maximum number of tasks that can run across your entire environment.
- Global parallelism: Limits the total number of tasks that can run concurrently in your Airflow setup.
By reviewing these parameters, you can identify and address potential bottlenecks in your workflow.
How do I choose values for parallelism and per-DAG limits?
To configure concurrency in Apache Airflow, it's all about aligning your system's capacity with the demands of your workflows. Start with core.parallelism, which sets the maximum number of task instances that can run across your entire environment. This value is multiplied by the number of active schedulers.
At the DAG level, you can fine-tune concurrency further. Use max_active_tasks_per_dag to cap the number of active tasks within a single DAG, helping to avoid overloading your resources. Similarly, adjust max_active_runs_per_dag to control the number of concurrent runs or backfills for a specific DAG.
If you notice tasks lingering in the "scheduled" state even though resources seem available, it's worth revisiting these limits. For more granular control, Airflow pools can help you manage task execution based on resource availability. This way, you can ensure a smoother workflow without overwhelming your infrastructure.
When should I use pools instead of raising concurrency?
Using pools is a smart way to manage parallel execution for tasks that rely on shared resources like APIs or databases. While concurrency settings at the DAG level help control the number of tasks running within a single DAG, pools take it a step further by managing shared slots across multiple DAGs. This prevents external systems from being overwhelmed.
Pools also offer more precise control by using pool_slots. By assigning these slots to tasks, you can ensure that resource-intensive operations are handled in a balanced and efficient way.