
How Airflow Supports Analytics Monitoring
Apache Airflow is a Python-based tool for managing and monitoring data workflows. It uses Directed Acyclic Graphs (DAGs) to define tasks, their dependencies, and schedules. This makes it a go-to solution for orchestrating analytics pipelines, a core skill taught in entry-level data engineering boot camps. With integrations like Snowflake, dbt, and Databricks, Airflow automates processes like data ingestion and transformation.
Here’s why monitoring analytics workflows matters:
- Detect Silent Failures: DAGs may run without errors, but data issues (e.g., missing or outdated data) can silently disrupt dashboards and reports.
- Key Monitoring Focus Areas: Freshness, volume, schema changes, data distribution, and lineage ensure data reliability.
To optimize monitoring in Airflow:
- Core Components: Scheduler, webserver, metadata database, and DAG processor.
- Setup Tips: Use Docker or Helm for deployment, configure
airflow.cfgfor health checks, and enable the REST API for external monitoring. - UI Tools: Grid, Graph, and Gantt views help visualize workflows, spot bottlenecks, and analyze task durations.
Advanced monitoring includes:
- Logs and Alerts: Use tools like Sentry for error tracking and set up email or Slack notifications for failures.
- Metrics Integration: Combine StatsD, Prometheus, and Grafana for real-time insights into task performance and scheduler health.
Airflow's scalability with Celery or Kubernetes executors makes it ideal for complex workflows, though proper configuration is crucial to avoid database bottlenecks and performance issues. By leveraging its features effectively, teams can maintain reliable and efficient analytics pipelines.
Airflow monitoring: Get insights into your DAG and system
sbb-itb-61a6e59
Setting Up Airflow for Monitoring
Apache Airflow Architecture Components and Monitoring Setup
To keep your workflows running smoothly, it's essential to set up Airflow's architecture in a way that allows you to monitor workflow health, identify failures early, and maintain pipeline reliability.
Key Components for Airflow Monitoring
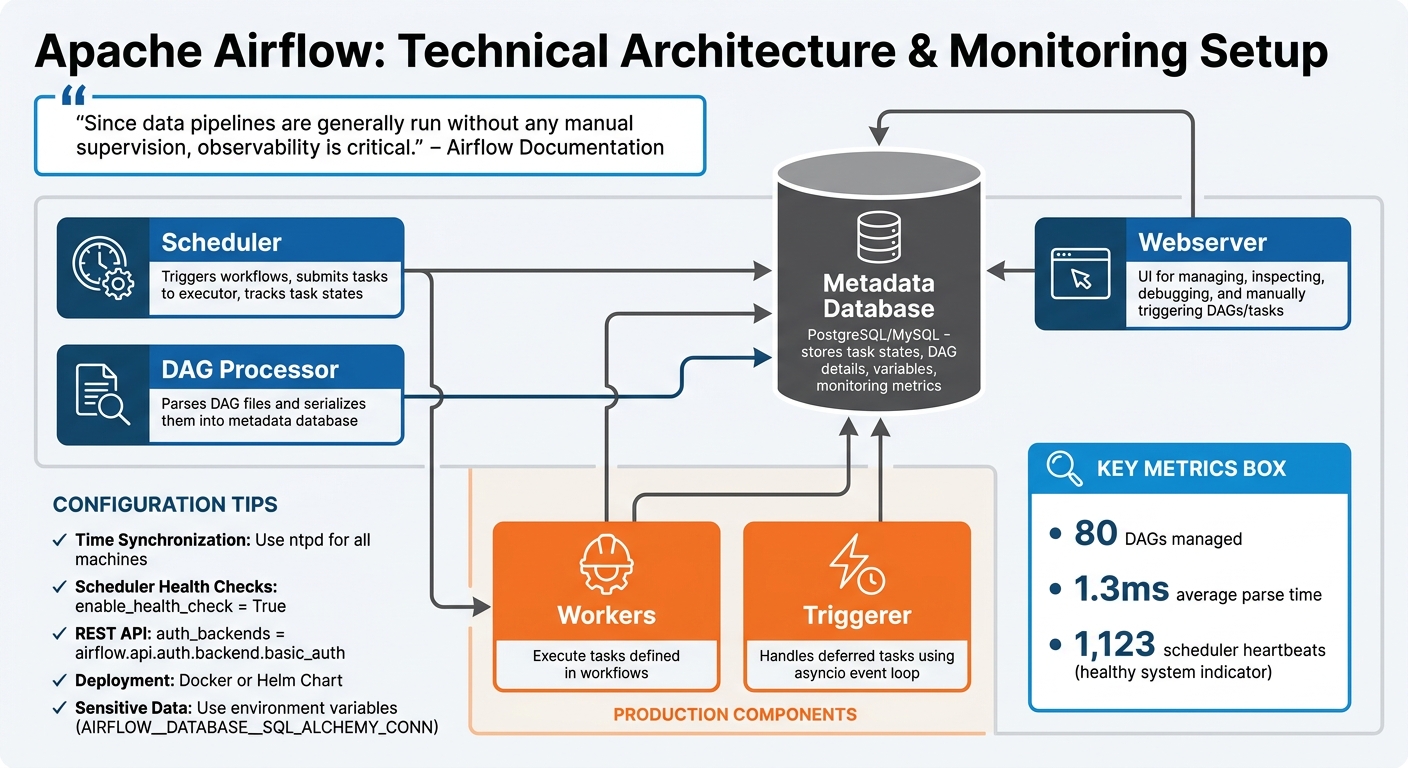
A standard Airflow setup revolves around four main components:
- Scheduler: This is the backbone of Airflow. It triggers workflows, submits tasks to the executor, and keeps track of task states.
- Webserver: The user interface for managing Airflow. Here, you can inspect, debug, and manually trigger DAGs and tasks.
- Metadata Database: Typically PostgreSQL or MySQL, this database acts as the central repository. It stores task states, DAG details, variables, and monitoring metrics.
- DAG Processor: This component parses your DAG files and serializes them into the metadata database, making them accessible to both the scheduler and the webserver.
In production environments, you'll need additional components to handle the workload effectively:
- Workers: These execute the tasks defined in your workflows.
- Triggerer: Handles deferred tasks using an asyncio event loop.
For context, a robust Airflow deployment can manage around 80 DAGs with an average parse time of 1.3ms. A scheduler producing approximately 1,123 heartbeats is a good indicator of a healthy system.
"Since data pipelines are generally run without any manual supervision, observability is critical." - Airflow Documentation
Once these components are in place, the next step is configuring them for efficient monitoring and performance.
Installing and Configuring Airflow
To set up Airflow for scalable monitoring, use either the official Docker image or Helm Chart. Configuration is managed through the airflow.cfg file or environment variables. For sensitive information like database connection strings (AIRFLOW__DATABASE__SQL_ALCHEMY_CONN), always use environment variables instead of storing them in configuration files.
Here are some key configuration tips:
- Time Synchronization: Ensure all machines running Airflow components are synchronized using tools like
ntpd. This prevents issues like "forbidden" errors when accessing logs or making API requests. - Scheduler Health Checks: Enable these by setting
enable_health_check = Truein the[scheduler]section of the configuration file. - REST API for External Monitoring: To integrate with external dashboards, enable the REST API by setting
auth_backends = airflow.api.auth.backend.basic_authin the[api]section. This allows you to programmatically extract metadata about DAG runs and task durations without directly querying the database.
For those looking to fine-tune their Airflow monitoring or learn more about analytics pipelines, check out the training resources available at DataExpert.io Academy (https://dataexpert.io).
Using the Airflow UI for Workflow Insights
Once your Airflow environment is set up, the UI becomes your go-to tool for keeping an eye on analytics pipelines in real time. For systems where timely data delivery is crucial, these tools help you stay on top of workflow performance. The interface offers several visualization options to monitor workflow health, identify failures, and fine-tune performance. Mastering these tools is a key part of a comprehensive data engineering course.
Visual Monitoring with DAG Views
The Grid View provides a heatmap of task outcomes over time, using a clear color-coded system: green for success, red for failures, yellow for tasks in progress, and orange for tasks queued for retry. At the top of the view, there's a bar chart showing DAG run durations, which makes it easy to spot longer pipeline executions. This color scheme helps teams address issues 35% faster. Together, these tools simplify the process of pinpointing bottlenecks and other problems in your pipelines.
The Graph View lays out the logical structure of your DAG, showing how tasks are connected and dependent on each other. This view is especially handy for debugging dependency-related failures. For example, it can clarify if a task was skipped due to a trigger rule or an error upstream. In Airflow 3.x, task duration indicators are added to each node, making it easier to trace failure paths and locate downstream blockers.
For a deeper dive into bottlenecks, the Gantt Chart is invaluable. It provides a timeline of a single DAG run, showing task concurrency and durations. Tasks with long bars stand out as the ones consuming the most time. Teams that regularly analyze Gantt charts to identify opportunities for parallelization report managing nearly 70% more tasks without needing data engineering bootcamps.
Task Duration and Performance Insights
Airflow also offers detailed insights into how individual tasks perform. The Task Duration view charts execution times for specific tasks across recent runs, making it easy to spot anomalies and trends. For instance, if a task that usually finishes in 5 minutes suddenly takes 15, this view highlights the issue right away. Addressing such outliers can reduce processing times by 30%. A good rule of thumb is to investigate any task exceeding its average execution time by 20% or more.
Around 25% of task failures in production are linked to misconfigured parameters. You can uncover these issues by reviewing execution logs, XCom data, and rendered templates within the Task Instance Details. Additionally, leveraging the UI's alerting systems allows teams to respond up to 60% faster to operational problems, minimizing downtime and ensuring pipeline reliability.
Advanced Monitoring Tools in Airflow
Airflow goes beyond its user-friendly interface, offering advanced monitoring tools that help teams identify and address issues before they escalate. These tools provide detailed insights, automate responses to failures, and integrate seamlessly with external systems for better oversight. Let’s explore how logging, alerts, and metrics can be utilized to stay ahead of potential problems.
Logging and Error Tracking
Airflow generates logs from three main components: the Web server, the Scheduler, and the Workers that execute tasks. While logs are stored locally by default, they can also be routed to cloud providers like AWS, Google Cloud, or Azure using community-provided handlers. For distributed setups, tools like FluentD allow logs to be forwarded to platforms such as Elasticsearch or Splunk. Efficient log management can cut troubleshooting time by as much as 30%.
For real-time error tracking, Airflow integrates with Sentry. After installing the Sentry subpackage (pip install "apache-airflow[sentry]"), you can enable it by setting sentry_on = True in the [sentry] section of airflow.cfg and providing a SENTRY_DSN. Sentry automatically adds metadata - like dag_id, task_id, operator, and data_interval_start - to errors, making it easier to pinpoint and resolve issues. Additionally, Airflow 3.2.0 introduces OpenTelemetry support, enabling DAG authors to embed custom spans within tasks for detailed performance diagnostics. These tools ensure workflows remain accurate and dependable, especially in embedded analytics.
To complement error tracking, Airflow also offers robust alerting options to ensure timely responses.
Setting Up Alerts for Workflow Failures
Alerts are key to ensuring quick action when workflows encounter problems. For email notifications, you’ll need to configure SMTP settings in airflow.cfg (e.g., smtp_host, smtp_user, and smtp_port). Once set, parameters like email_on_failure=True and email_on_retry=True in task definitions or default_args can automatically trigger emails for failures or retries.
For more flexibility, Airflow supports callbacks like on_failure_callback, which can trigger a custom Python function or external notifier when a task or DAG fails. Pre-built notifiers, such as SlackNotifier or AppriseNotifier, simplify the process of sending alerts to external platforms. As Manmeet Kaur Rangoola, Senior Data Engineer at Astronomer, explains:
"Using the Airflow UI and built-in notifications is one of the quickest and easiest way to setup an effective monitoring system for your Airflow DAGs".
Another helpful feature is SLA monitoring, which triggers an sla_miss_callback if a task exceeds its expected duration. Automated retries with exponential backoff can also resolve transient issues in 60% of cases without requiring manual intervention. These alerting mechanisms are crucial for maintaining the stability of workflows in embedded analytics environments.
Integrating Metrics with Prometheus and Grafana
Airflow provides internal metrics - such as task durations, success rates, and scheduler heartbeats - via the StatsD protocol. To make these metrics compatible with Prometheus, you’ll need a bridge like the prometheus-statsd-exporter. The typical integration workflow looks like this: Airflow (StatsD) → StatsD Exporter → Prometheus (scraping) → Grafana (visualization).
To enable this setup, configure statsd_on in airflow.cfg and specify statsd_host and statsd_port (default is 8125). Once Prometheus collects the data, it can be visualized in Grafana, where teams can build dashboards to identify patterns and correlations. For instance, a spike in DAG parse time might explain scheduler delays. As Neova Solutions puts it:
"Monitoring Airflow is not about watching logs after something breaks. It is about understanding behavior in real time".
Using metrics effectively can improve response times by up to 30%, while distributed tracing tools can speed up issue detection by 40%. Setting threshold alerts - like flagging tasks that exceed three standard deviations in execution time - helps identify anomalies early. Monitoring the scheduler_heartbeat metric can also reveal if the scheduler is falling behind before tasks start missing SLAs. These integrations ensure workflows are continuously monitored and optimized.
Best Practices for Maintaining Analytics Pipelines in Airflow
Scaling DAGs for Embedded Analytics
When scaling Airflow for embedded analytics, your choices around executors and resource management play a critical role in maintaining reliability. For instance, the default SequentialExecutor can only handle one task at a time, which can create bottlenecks in analytics workloads. To address this, consider using CeleryExecutor for distributed task execution or KubernetesExecutor for isolating resources at the pod level.
To ensure tasks are reliable and repeatable, design them to be idempotent. This means using operations like UPSERT and partition-specific reads/writes, leveraging the execution_date parameter. This approach helps avoid data duplication during retries. Additionally, limit the use of XCom to transferring small metadata. Larger datasets should be offloaded to remote storage solutions like S3, HDFS, or GCS, which also ensures accessibility across worker nodes.
Another efficiency tip: access Airflow Variables only within operators or Jinja templates. Including them in the top-level DAG code can lead to excessive metadata database connections, as DAGs are parsed every second by default. Instead, repetitive parameters like connection_id or file paths should be defined in default_args to reduce errors and ease the load on the database.
For production environments, set up remote logging (e.g., S3, Elasticsearch, or CloudWatch) to retain logs and simplify troubleshooting. If you're building custom BI dashboards with tools like Looker or Tableau, use the Airflow REST API to extract metrics. As Astronomer advises:
"Querying the database directly can affect the performance of your database, and limit the connections available for use by your Airflow DAGs, adversely affecting their runtime".
By following these practices, you can create robust and efficient pipelines, laying a strong foundation for monitoring and maintaining analytics workflows.
Airflow Monitoring: Strengths and Limitations
Airflow offers a mix of strengths and challenges when it comes to monitoring. Here's a quick breakdown:
| Strengths | Limitations |
|---|---|
| Handles large-scale tasks with Kubernetes/Celery executors | Complex initial setup for multi-node clusters |
| Real-time visibility through Grid/Graph views and REST API | UI performance decreases with a high volume of DAGs |
| Integrates with Prometheus, Grafana, and Slack for alerts | Advanced observability setups have a steep learning curve |
| Offers fine-grained control over task concurrency and retries | Metadata database can become a bottleneck if Variables are misused |
| Tracks SLA misses with built-in callbacks | SLA alerts only apply to scheduled DAGs, not manual triggers |
For smaller projects, Airflow's resource demands might feel excessive. However, when managing complex workflows in embedded analytics systems, its scalability and integration options make it a powerful choice.
Conclusion
Apache Airflow has proven itself as a go-to solution for managing and monitoring embedded analytics workflows, trusted by over 77,000 organizations as of late 2024. Its ability to scale, combined with powerful monitoring tools and flexible integrations, makes it indispensable for handling complex data systems.
With Celery and Kubernetes executors, Airflow can process thousands of tasks simultaneously. Its programmatic design ensures pipelines are version-controlled and auditable, providing both reliability and transparency. Tools like Grid, Graph, and Gantt views, paired with integrations for Prometheus, Grafana, and Slack, transform Airflow from a simple scheduling tool into a robust observability platform.
Airflow also excels in failure management. Built-in notifications and automated retries resolve 60% of transient issues without manual intervention, reducing operational bottlenecks. Features like SLA tracking further enhance its utility in production environments, ensuring teams can meet performance targets with confidence.
The benefits extend to troubleshooting and downtime reduction. Effective log management can cut troubleshooting time by 30%, while integrated alerting reduces downtime by up to 70%. For teams focused on data-driven products, Airflow's REST API enables the creation of custom BI dashboards for tracking success rates and execution trends - without straining database resources.
Whether you're managing a single-machine setup or orchestrating analytics across platforms like Snowflake, Databricks, and BigQuery, Airflow provides the tools needed to maintain efficient and reliable data pipelines.
For more guidance and hands-on learning, visit DataExpert.io Academy (https://dataexpert.io) to explore training opportunities and deepen your understanding of Airflow's monitoring capabilities.
FAQs
What should I monitor beyond DAG failures?
To maintain reliable workflows, it's important to go beyond just keeping an eye on DAG failures. Pay attention to key metrics such as SLAs, task execution duration, success and failure rates, and pipeline health. Additionally, monitoring data freshness, volume, schema changes, distribution shifts, and data lineage offers a more complete picture. Together, these metrics help you assess performance and ensure everything runs smoothly.
How can I detect silent data issues in Airflow?
Catching silent data issues in Airflow requires more than just checking if tasks succeed. To ensure your data pipelines are truly reliable, you need to go deeper with continuous monitoring.
Start by incorporating data quality validation. For example, compare row counts to catch anomalies like missing data or sudden spikes. These checks help identify subtle problems that might otherwise slip through unnoticed.
Another key step is to track metrics over time, such as table row counts. By monitoring these trends, you can spot irregularities early. Pair this with alerts that notify you of any discrepancies, so you can take immediate action.
By combining validation checks, metric tracking, and alert systems, you’ll create a safety net that ensures your data remains accurate and dependable. This proactive approach can save you from unseen issues that might disrupt workflows or compromise analytics.
Which Airflow metrics best show scheduler health?
When keeping track of scheduler health in Airflow, two important metrics stand out:
- Latest Scheduler Heartbeat: This metric ensures the scheduler is active and functioning as expected. A consistent heartbeat indicates that the scheduler is responsive.
-
Scheduler Status: Accessible through the
/api/v2/monitor/healthendpoint, this status provides a clear indicator of the scheduler's health, labeling it as either "healthy" or "unhealthy."
Monitoring these metrics helps maintain a reliable and efficient workflow system.