
How To Add Data Quality Checks in Pipelines
Your data pipeline is only as reliable as its quality checks. Without them, flawed data can lead to costly mistakes and erode trust. Here's how you can ensure data quality using tools like Great Expectations and dbt-expectations:
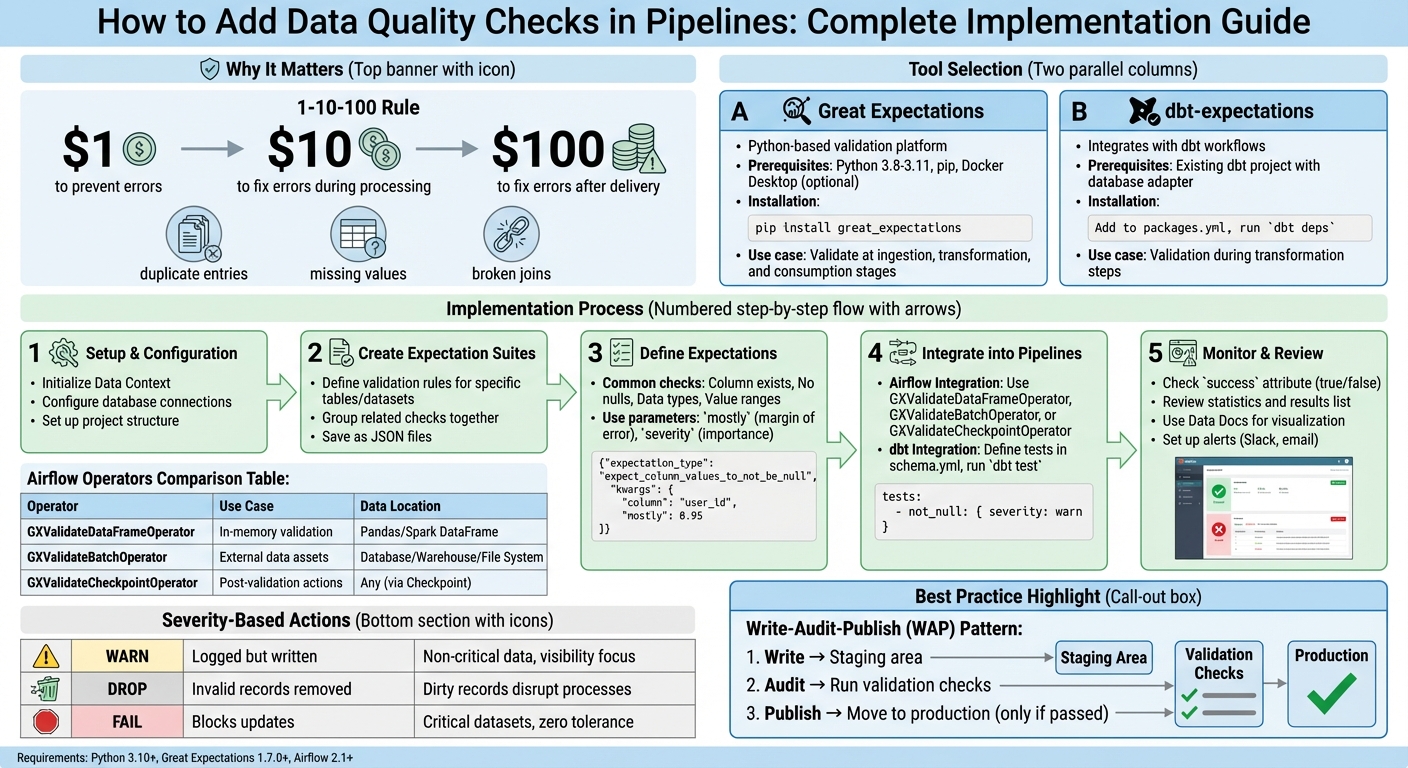
- Why It Matters: Catching data issues early saves time and money. The 1-10-100 rule shows fixing errors later costs significantly more.
- Common Issues: Duplicate entries, missing values, and broken joins can disrupt analysis and downstream processes.
- Tools You Need:
- Great Expectations: Python-based platform for defining and running validation tests.
- dbt-expectations: Integrates quality checks directly into dbt workflows.
- How It Works: These tools allow you to validate data at key stages - during ingestion, after transformations, and before consumption in an analytics engineering boot camp setting.
Learn how to set up these tools, create validation rules, and integrate checks into workflows like Airflow or dbt for automated, reliable data quality monitoring.
Complete Guide to Implementing Data Quality Checks in Pipelines
How to Build a Data Quality Monitoring System with Great Expectations & Airflow
sbb-itb-61a6e59
Setting Up Your Data Quality Tools
Before diving into data validation, it's crucial to set up the right tools. This section walks you through installing and configuring Great Expectations and dbt-expectations. To get started, ensure you have Python 3.8–3.11, pip, and optionally a virtual environment like venv or conda. If you're working with containerized pipelines, having Docker Desktop is also recommended. Once these prerequisites are in place, follow the steps below to set up each tool.
Installing and Initializing Great Expectations
To install Great Expectations, run the command:
pip install great_expectations
After installation, initialize your project by adding the following to your script or Jupyter Notebook:
context = gx.get_context(mode="file")
This creates a Data Context, which acts as the central hub for managing configurations, Expectation Suites, and validation results. When initialized, a great_expectations folder is automatically generated in your project directory. This folder contains all the necessary metadata and configuration files.
You'll primarily interact with this folder using your IDE, such as VSCode, and use a web browser to view Data Docs or configure settings in Jupyter Notebook. This setup provides a clear and organized structure for managing your data quality workflows.
Installing and Configuring dbt-expectations
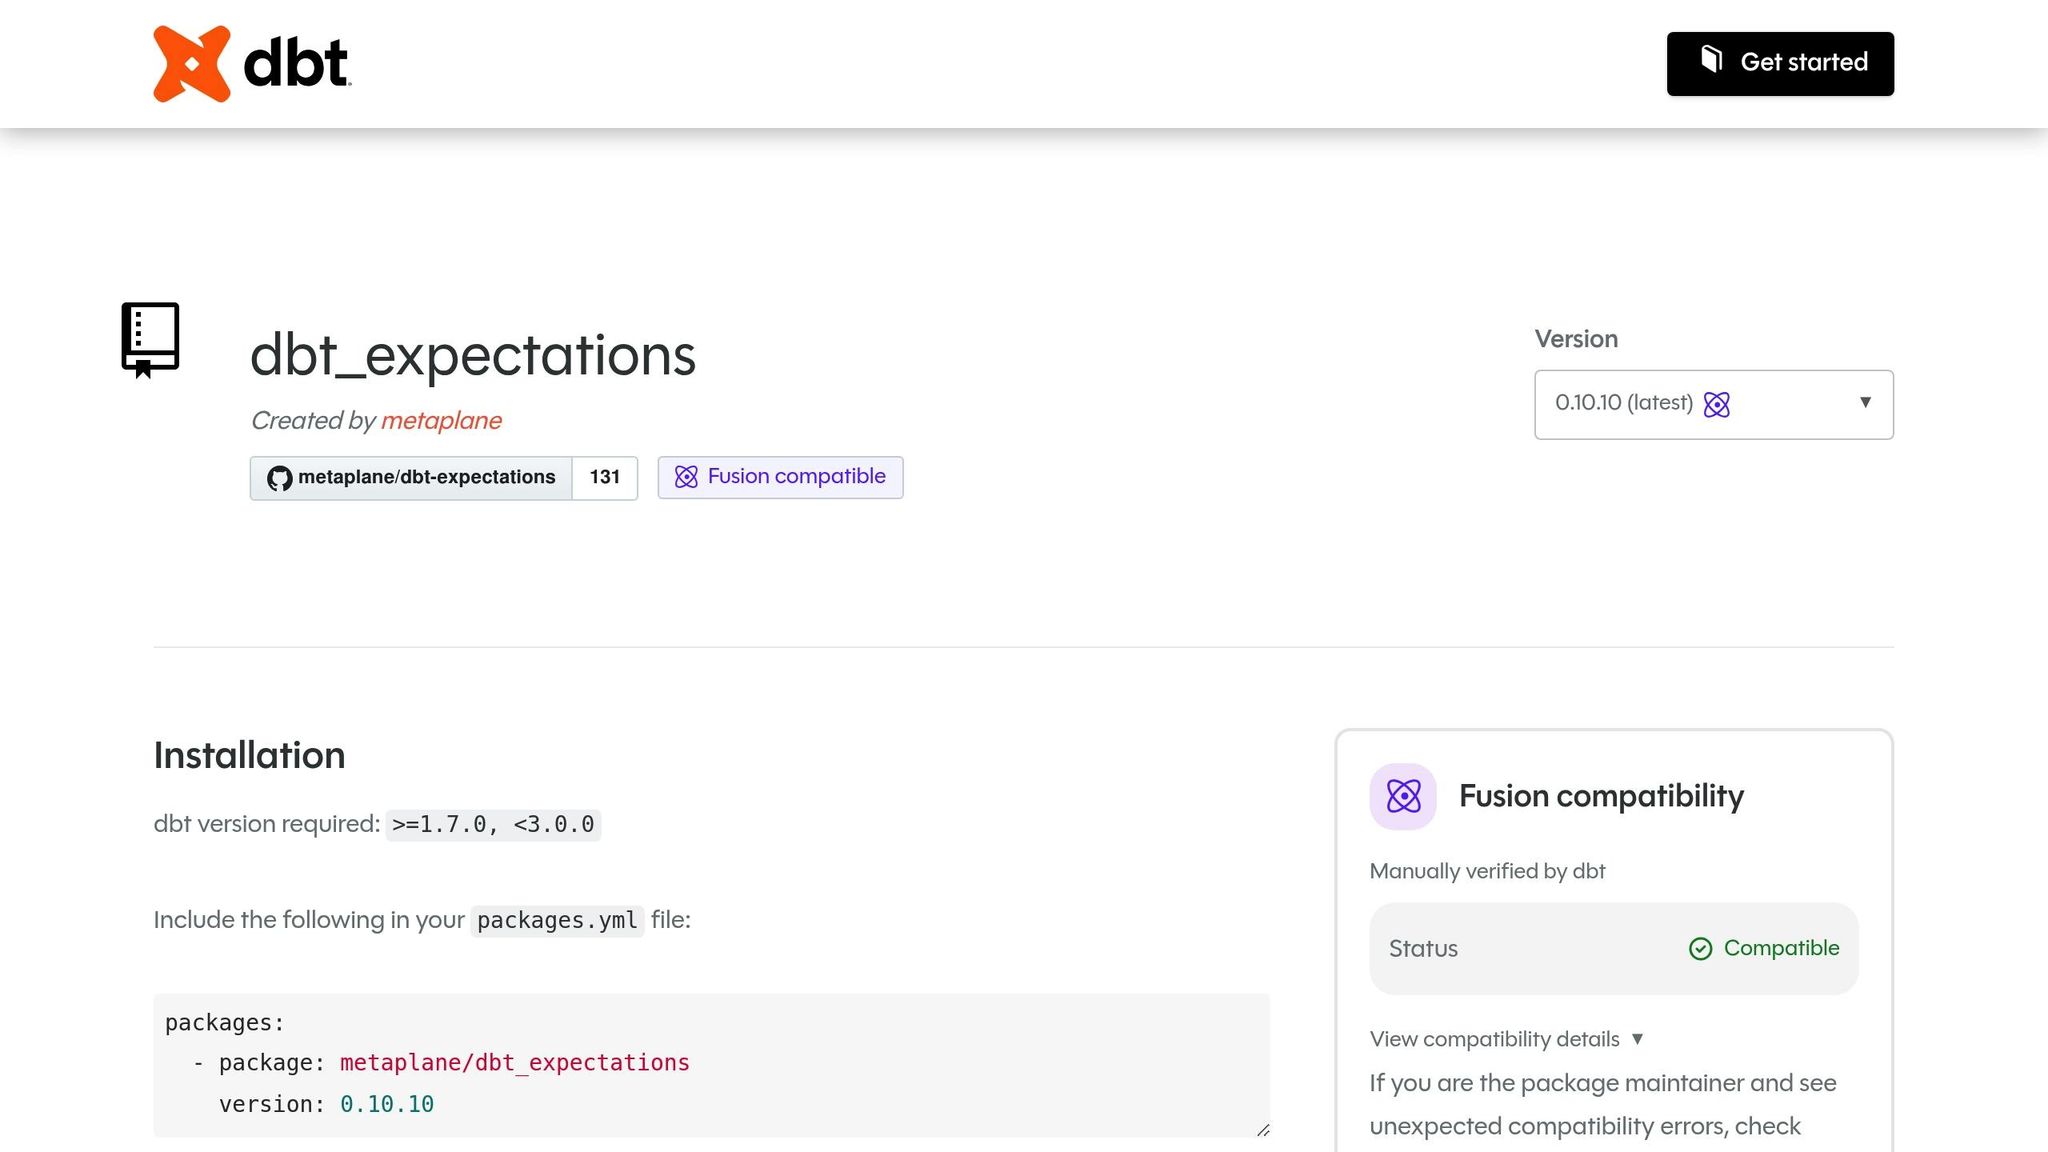
To integrate dbt-expectations, you’ll need an existing dbt project with a configured database adapter, such as dbt-postgres. Start by editing the packages.yml file in your dbt project. Add the following line to include the calogica/dbt_expectations package:
packages:
  - package: calogica/dbt_expectations
    version: [">=0.8.0", "<0.9.0"]
After updating the file, run:
dbt deps
This downloads and installs the package into your dbt environment.
dbt-expectations allows you to define validation tests declaratively in YAML files, such as schema.yml, under the tests key for specific models or columns. This eliminates the need to write custom SQL for every validation scenario, streamlining the process of enforcing data quality rules. For those looking to master data engineering and advanced pipeline automation, specialized training can accelerate your expertise. Once configured, you can easily integrate these validations into your pipelines to ensure data reliability.
Building Data Quality Checks with Great Expectations
Once your tools are set up, you can start enforcing data integrity by creating Expectation Suites - these are rules that validate your data. Each suite typically focuses on a specific table or dataset, grouping related checks together. These suites are saved as JSON files in the great_expectations/expectations directory.
Creating Expectation Suites
Great Expectations makes it easy to create suites, with the programmatic approach being particularly straightforward. Here's how to get started:
-
Instantiate a new suite and register it with your Data Context:
suite = gx.ExpectationSuite(name="customers_suite") context.suites.add(suite) -
Alternatively, use the interactive Validator method to test and adjust expectations in real time. First, create a
BatchRequestto load your data. Then, initialize a validator and define expectations directly:validator = context.get_validator(batch_request=batch_request, expectation_suite_name="customers_suite") validator.expect_column_to_exist(column="customer_id") validator.save_expectation_suite()
Once your suite is created, you can begin defining specific expectations to ensure your data meets the required standards.
Defining Expectations for Data Validation
Expectations are the rules that validate your data. Common checks include verifying columns exist, ensuring no null values, validating data types, and confirming numeric values fall within a specified range. You can also use parameters like mostly to allow a small margin of error or severity to categorize the importance of each check.
For example, in a 2024 technical tutorial, Great Expectations Labs showcased a validation process for a PostgreSQL customers table in a "jaffle_shop" data pipeline. They created an Expectation Suite with two checks: ensuring customer_id values are never null (ExpectColumnValuesToNotBeNull) and confirming lifetime_spend values fall between 0 and 100,000 (ExpectColumnValuesToBeBetween). These validations were automated using an Airflow DAG, which triggered a GX Checkpoint to update Data Docs after completion.
Here’s how to add these expectations programmatically:
expectation = gx.expectations.ExpectColumnValuesToNotBeNull(column="customer_id")
suite.add_expectation(expectation)

expectation = gx.expectations.ExpectColumnValuesToBeBetween(
    column="lifetime_spend",
    min_value=0,
    max_value=100000
)
suite.add_expectation(expectation)
You can test these expectations immediately using batch.validate(). For instance, during development with a taxi trip dataset, a user tested ExpectColumnMaxToBeBetween for the passenger_count column, setting the range to 1–6. The first test failed (success: false) because the observed value was 6, while the max_value was set to 5. After adjusting the max_value to 6, the validation succeeded. This highlights the importance of aligning your expectations with actual data patterns and fine-tuning them before moving to production.
Once your checks are validated, the next step is to integrate them into your pipeline workflows.
Adding Data Quality Checks to Your Pipelines
Once you've built your expectations, the next step is integrating them into your pipelines. This ensures your validations run automatically, catching issues early in the process and maintaining data quality throughout the pipeline's lifecycle.
Adding Checks to Airflow Pipelines
To incorporate Great Expectations into Airflow, you'll need the airflow-provider-great-expectations package. This package includes specialized operators that let you run validations directly within your DAGs. You can install it with:
pip install airflow-provider-great-expectations
Keep in mind the compatibility requirements: Python 3.10+, Great Expectations 1.7.0+, and Airflow 2.1+.
When it comes to integrating data quality checks, you have two main approaches:
- Embed checks within your main DAG: This works well with the Write-Audit-Publish pattern, where data is validated in staging before moving to production.
- Use a separate DAG: Ideal for complex statistical analyses or periodic checks on entire tables that aren't time-sensitive.
The package provides three operators to replace the older GreatExpectationsOperator:
- GXValidateDataFrameOperator: Best for validating in-memory data like Pandas or Spark DataFrames.
- GXValidateBatchOperator: Designed for direct connections to external databases, warehouses, or file systems.
- GXValidateCheckpointOperator: Offers the most features, including triggering notifications (e.g., Slack or email) based on validation results.
For managing credentials, helper functions like build_snowflake_connection_string can simplify connection setups using Airflow's connection management tools.
| Operator | Recommended Use Case | Data Location |
|---|---|---|
| GXValidateDataFrameOperator | For in-memory data validation | Pandas or Spark DataFrame |
| GXValidateBatchOperator | When working with external data assets | Database, Warehouse, or File System |
| GXValidateCheckpointOperator | Supports post-validation actions (e.g., alerts) | Any (via Checkpoint definition) |
While Airflow excels at pre-load validations, dbt-expectations is a great fit for embedding checks into transformation steps.
Using dbt-expectations in dbt Workflows
For validating data during transformations, dbt-expectations integrates directly into your dbt models. Unlike Airflow, which operates at the orchestration level, dbt runs these checks during the transformation itself. To get started, add dbt-expectations to your packages.yml file and install it with dbt deps. Then, define your expectations in the model's YAML configuration file (e.g., schema.yml) under the tests or data_tests key, and execute dbt test to run the validations.
You can fine-tune the severity of these checks to balance stability and visibility. For instance:
- Use
severity: warnfor non-critical checks, such as detecting outliers. These won't crash your CI pipelines but will alert your team. - Reserve
severity: errorfor critical checks, like ensuring primary keys aren't null.
You can also apply environment-specific rules using Jinja and target.name. For example, you might require at least 1,000 rows in production but only 1 in development.
The package supports a variety of validations, from simple checks (e.g., expect_column_values_to_be_between for numerical ranges) to complex scenarios like cross-column validation (e.g., ensuring a return_date exists only if order_status is 'returned'). It even handles semi-structured data, including JSON schema validation for nested structures.
Note: As of December 18, 2024, the original dbt-expectations package is no longer actively maintained. Development has shifted to a fork maintained by Metaplane.
Reviewing and Monitoring Data Quality Results
Running and Reviewing Validation Results
When you run validations, they generate an ExpectationSuiteValidationResult object. This object includes a success attribute that instantly tells you whether your data passed or failed (true/false). For a deeper dive, check the statistics attribute, which breaks down how many expectations were executed and what percentage of them passed.
To pinpoint specific issues, review the results list. This list provides details about each check, including its configuration and observed outcomes. For instance, the expectation_config shows the rule applied (e.g., expect_column_max_to_be_between), while the result attribute reveals the actual observed_value in your data. By comparing these, you can figure out why a check failed. If you spot an exception_info attribute, it signals a technical error rather than a data inconsistency.
Great Expectations Data Docs offer a user-friendly way to view validation outcomes, complete with clear pass/fail indicators. To save time when reviewing historical runs, use the "Failures Only" filter to zero in on problematic batches without sifting through successful ones. For proactive issue management, configure Actions within Checkpoints to send alerts (via Slack or email) when success is false. These tools and insights form the backbone of a reliable monitoring strategy.
Best Practices for Ongoing Data Quality Monitoring
To maintain high data quality over time, follow these best practices. Start with the Write-Audit-Publish (WAP) pattern: write data to a staging area, audit it with validation checks, and only publish it to production if it passes. This approach safeguards stakeholders from receiving flawed data. As Daniel Poppy from dbt Labs puts it:
"High-quality data is the foundation of trustworthy analytics. But without automated checks, even modern pipelines can quietly deliver incomplete, stale, or incorrect information - leading to costly business decisions".
Track data quality trends by organizing your data into batches (e.g., daily or monthly). For more advanced monitoring, analyze system event logs - like Lakeflow Spark Declarative Pipelines logs - to gather raw metrics for custom dashboards. Use severity-based alerts to categorize issues: set "warn" for minor problems that don’t disrupt workflows, and "fail" for critical errors that demand immediate attention. Automate validations to run after every data refresh and before reports are published. This ensures your analytics remain accurate and up-to-date. By embedding these strategies into your pipeline, you can ensure that only validated data moves forward.
| Action | Result | Use Case |
|---|---|---|
| Warn | Invalid records are logged but written | For non-critical data where visibility is more important than blocking |
| Drop | Invalid records are removed | For datasets where dirty records would disrupt downstream processes |
| Fail | Blocks updates; requires manual review | For critical datasets where incorrect data cannot be tolerated |
Conclusion
Integrating data quality checks into your workflows isn't just a good practice - it’s a necessity to avoid costly mistakes. The 1–10–100 rule highlights how catching data issues early can save significant time and money. Tools like Great Expectations and dbt-expectations help automate these checks, acting as a safety net to catch errors before they impact stakeholders.
Strong validation frameworks are at the heart of resilient data pipelines. Using the Write-Audit-Publish pattern ensures that only validated data makes it to production. Pair this with severity-based alerts to handle issues efficiently. Start with straightforward tests, such as checking for uniqueness and non-null values in critical tables. Once you’ve nailed the basics, expand to more advanced checks like distribution analysis and referential integrity validations. Automating these processes also helps catch logic errors during development, reducing the risk of problems surfacing in production.
"High-quality data is the foundation of trustworthy analytics. But without automated checks, even modern pipelines can quietly deliver incomplete, stale, or incorrect information - leading to costly business decisions".
Data errors don’t just waste resources - they undermine trust and lead to poor decisions. Gaining expertise in these techniques takes practice, and that’s where DataExpert.io Academy comes in. They offer specialized boot camps and subscriptions tailored to data engineering and analytics engineering. With hands-on training using tools like Databricks, Snowflake, and AWS, you’ll get real-world experience building robust data quality frameworks. These programs include capstone projects, guest speaker sessions, and access to a thriving learning community, giving you the skills to design reliable, trustworthy data pipelines.
FAQs
Where should I run data quality checks in my pipeline?
Building data quality checks into your pipeline is essential at critical stages such as data ingestion, transformation, or just before loading data into its final storage. Incorporating these checks early in the process helps catch potential issues before they escalate.
Tools like Great Expectations are particularly effective for validating data at every step. They allow you to ensure that your data meets the required standards and is consistent throughout the pipeline.
Additionally, you can embed these quality checks into workflows managed by orchestration tools like Airflow. This approach helps maintain data integrity across the entire pipeline execution, ensuring reliable and trustworthy results.
How do I decide which checks should warn vs fail?
Deciding between warning checks and failing checks comes down to how serious the issue is and its potential effect on downstream processes.
- Fail checks are reserved for critical issues, such as null values in key columns or data in invalid formats. These stop the pipeline entirely to prevent flawed data from causing further problems.
- Warn checks, on the other hand, highlight less severe anomalies, like small deviations, allowing the pipeline to continue while notifying teams of the issue.
The decision should reflect the specific business priorities and how vital the data is to operations.
How can I alert my team when a validation fails?
Great Expectations allows you to configure notifications to alert your team when a validation fails. This can help ensure that issues are caught and addressed quickly.
You can set up Slack alerts by using a webhook URL to send messages directly to your team's Slack channel whenever a validation fails. Similarly, email alerts can be configured within your pipeline to notify relevant team members.
If you're using GX Cloud, managing alerts is even more streamlined. You can specify the alert type and provide the webhook URL directly through the platform.
For teams with unique needs, Great Expectations also supports custom actions, allowing you to create tailored notification systems that fit your workflow perfectly.