How to Debug Airflow DAG Failures
Debugging Airflow DAG failures can feel overwhelming, but it doesn’t have to be. Here's a quick breakdown to help you identify and fix issues efficiently:
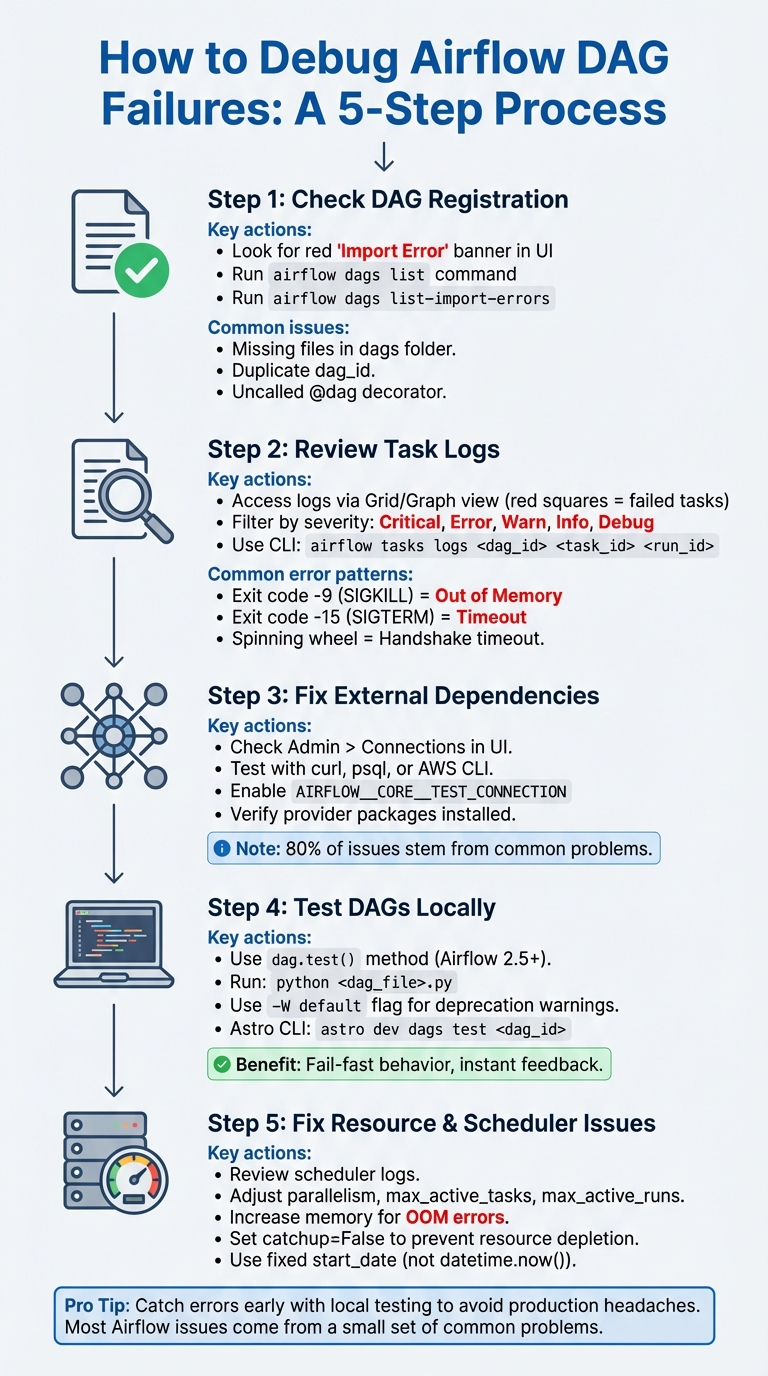
- Check DAG Registration: Ensure your DAG is recognized by Airflow. Look for import errors in the UI or use CLI commands like
airflow dags listandairflow dags list-import-errorsto troubleshoot. - Review Task Logs: Dive into task logs for error messages and patterns. Common issues include memory errors, timeout signals, and connection problems.
- Fix External Dependencies: Verify connections to databases, APIs, or cloud services. Use tools like
curlorpsqlto test them independently. - Test DAGs Locally: Use
dag.test()for quick local testing to catch errors before deployment. - Address Resource and Scheduler Issues: Adjust memory, CPU, and scheduling configurations to tackle production-specific bottlenecks.
5-Step Process for Debugging Airflow DAG Failures
5 MUST KNOW Airflow debug tips and tricks | Airflow Tutorial Tips 1
Step 1: Check DAG Import and Registration
When a DAG fails, the first thing to do is confirm that Airflow recognizes your DAG. If the scheduler can't parse or register the file, the DAG won't show up in the UI, which means it can't execute or be debugged.
Verify DAG Registration in the Airflow UI
Start by looking for a red "Import Error" banner at the top of the Airflow UI. This banner shows up when Airflow encounters parsing errors and often includes a traceback to help pinpoint the issue. If your DAG is missing but no error banner is visible, the problem might be with file placement. Make sure your DAG files are located in the dags folder specified in your airflow.cfg configuration. Also, Airflow only scans Python files containing both "airflow" and "DAG" (case-insensitive) to avoid processing unrelated files.
"Airflow ignores files not containing 'airflow' and 'DAG' in order to prevent the DagBag parsing from importing all python files collocated with user's Dags." - Airflow Documentation
Remember, Airflow scans the dags folder every 5 minutes. If you've just added or updated a file, you may need to wait for the next scan or force a refresh with airflow dags reserialize.
If the UI doesn't provide clear answers, you can dig deeper using the CLI.
Use CLI Commands to List DAGs
The Airflow CLI is an excellent tool for verifying DAG registration. Use the airflow dags list command to confirm whether your DAG is registered in the metadata database. If the DAG shows up in the CLI but not in the UI, try restarting the webserver. For more details on parsing issues, run airflow dags list-import-errors to view tracebacks for files that failed to load.
| Command | Purpose |
|---|---|
airflow dags list |
Verify if the DAG is registered in the database |
airflow dags list-import-errors |
View tracebacks for parsing failures |
airflow dags reserialize |
Force the scheduler to re-parse and update DAGs |
Fix Import Errors
Import errors, often caused by syntax issues or missing dependencies, should be addressed immediately. To quickly identify problems, run:
python <path_to_dag>.py
If the error points to a missing module, check if it's installed using:
pip freeze | grep <package-name>
For more complex issues, include the -W flag when running your script (e.g., python -W default <dag_file>.py) to catch deprecation warnings.
Common pitfalls to watch out for:
- If you're using the
@dagdecorator, ensure the decorated function is called at the end of your script; otherwise, the DAG won't register. - Duplicate
dag_idvalues can confuse the scheduler, causing it to alternate between them every 30 seconds. This can make one DAG flicker or disappear from the UI.
Step 2: Review Task Logs and Error Messages
Once you've confirmed the DAG is registered, the next step is to dive into the task logs. These logs are packed with error messages, stack traces, and execution details that can help you identify why a task failed.
Access Logs in the Airflow UI
To access logs, head to the Airflow UI and open either the Grid or Graph view. Failed tasks are marked with red squares - click on one, then navigate to the Log tab (or Instance Details > Log) to view the log file. If you're using Airflow 2.9.0 or newer, you’ll find a handy log-folding feature that lets you collapse sections you don’t need. You can also filter logs by severity level - Critical, Error, Warn, Info, Debug - to focus on the most relevant details.
If you encounter a spinning wheel or a blank log, it might indicate a handshake timeout or a dead worker process. By default, the log_fetch_timeout_sec setting is 5 seconds. Increasing this value in your configuration often resolves the issue. For tasks that are still running, Airflow streams logs in real time through an internal HTTP server (default port 8793) on the worker. However, if you’ve enabled remote logging (e.g., storing logs in S3 or GCS), those logs will only be available after the task finishes.
Once you have the logs, look for recurring patterns to zero in on the root cause of the issue.
Recognize Common Error Patterns
Certain error messages tend to pop up frequently and point to specific problems. For instance:
- A task ending with
Negsignal.SIGKILLor exit code-9signals an Out of Memory (OOM) error, meaning the process was terminated by the operating system for using too much memory. Fix this by allocating more memory to your worker or the pod running the task. - A
SIGTERMsignal (exit code-15) usually means the task exceeded thedagrun_timeoutsetting defined in your DAG. - Connection errors like "connection is not defined" suggest you need to verify the connection ID in the Airflow UI or install the required provider package.
Here’s a quick reference table for common errors:
| Error Pattern | Exit Code | Common Cause | Recommended Fix |
|---|---|---|---|
| Negsignal.SIGKILL | -9 | Out of Memory (OOM) | Increase worker/pod memory resources |
| SIGTERM | -15 | DAG or Task Timeout | Increase dagrun_timeout |
| Spinning wheel/Blank log | N/A | Handshake timeout or dead worker | Increase log_fetch_timeout_sec or check worker health |
| Task state changed externally | N/A | Heartbeat timeout or manual UI intervention | Check scheduler logs for heartbeat failures |
If you’re unable to access the UI, you can turn to the CLI for a deeper look into the logs.
Use CLI for Log Analysis
The CLI is a reliable backup when the UI isn’t accessible. It allows you to retrieve logs directly. To get logs for a specific task instance, use the following command:
airflow tasks logs <dag_id> <task_id> <run_id>
You can also run airflow info to check which task_logging_handler is active and where the base_log_folder is located. If logs are missing from the UI, examining the component logs (like scheduler, worker, or triggerer) via the CLI can often reveal why a process stopped before generating logs.
Step 3: Fix External System and Dependency Issues
Once you've reviewed your task logs, the next step is to address potential issues with external systems like databases, APIs, or cloud services that your DAG depends on. Kenten Danas, Senior Manager of Developer Relations at Astronomer, explains, "Improperly defined connections are one of the most common issues Airflow users have to debug when first working with their DAGs." Luckily, these problems are often easy to identify and fix.
Check Airflow Connections
Connection errors usually appear in task logs with messages such as 'connection_abc' is not defined or other errors mentioning "connection". When you encounter these, start by confirming that the connection exists and is set up correctly. In the Airflow UI, navigate to Admin > Connections and double-check the Connection Id, Host, Login, Password, and any Extra JSON parameters.
Keep in mind that connections defined through environment variables won't show up in the UI. Airflow looks for connections in this order: Secrets Backend, Astro Environment Manager, Environment Variables, and finally the Airflow Metadata Database (visible in the UI). If you're using environment variables, format them as AIRFLOW_CONN_YOURCONNID and provide the details either as a URI string or a JSON dictionary.
To test your connections directly in the UI, enable the environment variable AIRFLOW__CORE__TEST_CONNECTION. This adds a Test Connection button, allowing you to verify credentials without running a full DAG. Also, make sure to install the necessary provider package for your connection type. For example, Snowflake and Postgres connections will only work if you’ve installed the corresponding packages, such as apache-airflow-providers-snowflake or apache-airflow-providers-postgres.
Once your connections are configured, test the external systems your DAG relies on.
Test External System Functionality
Before debugging your Airflow code, check that the external system works independently. Use tools like curl for APIs, psql for Postgres databases, or the AWS CLI for S3 buckets. If the external system fails outside Airflow, the issue likely lies with the resource itself, its credentials, or network access.
Airflow 2.5+ introduced the dag.test() method, which lets you verify connections and variables in a single Python process. This method skips the scheduler, allowing faster debugging and enabling the use of IDE tools to resolve credential issues before deployment. Running dag.test() locally can help you confirm that your connections are functioning as expected without waiting for the full scheduler cycle.
Avoid placing connection requests or API calls at the top level of your DAG file (outside an operator). This code runs with every scheduler heartbeat and can cause performance issues or webserver timeouts. Instead, move such logic into a PythonOperator and consider increasing the web_server_master_timeout to at least 10 seconds to prevent crashes during connection-heavy parsing. If you're dealing with API rate limits, use Airflow pools to control the number of concurrent tasks accessing a specific external resource.
Once external systems are verified, it's time to ensure your dependencies align with your Airflow setup.
Verify Dependency Compatibility
If connection issues are resolved but your DAG still fails, dependency conflicts could be the problem. Missing or incompatible provider packages often lead to import errors in task logs. To check your environment, confirm that all required Python packages are installed. For containerized setups, you can run pip freeze inside the scheduler container. Astro CLI users can use the following command to verify specific packages:
astro dev bash --scheduler "pip freeze | grep <package-name>"
To avoid future compatibility problems, pin exact versions of provider and Python packages in your requirements.txt file. For example, use apache-airflow-providers-amazon==9.6.0 to lock the version. If different tasks need conflicting package versions, consider isolation strategies like ExternalPythonOperator, PythonVirtualEnvOperator, or KubernetesPodOperator to run tasks in separate virtual environments. Additionally, use the CLI command airflow dags list-import-errors to identify syntax or dependency issues preventing DAGs from appearing in the UI.
sbb-itb-61a6e59
Step 4: Test DAGs Locally
Once you've verified external dependencies, the next step is to test your DAGs locally. This step is crucial for catching syntax errors, logic flaws, or configuration issues before deploying to production. Local testing provides instant feedback, saving you time and helping you avoid costly production errors. As Kenten Danas, Senior Manager of Developer Relations at Astronomer, explains:
"Local development allows you to see and test your changes in real time, so you have instantaneous feedback and can catch and fix bugs early".
By combining external checks with local testing, you can address internal DAG issues right away, making it the last line of defense before deployment.
Use dag.test() for Local Testing
Starting with Airflow 2.5, the dag.test() method is the go-to approach for local testing. To use it, include a Python main block at the end of your DAG file like this:
if __name__ == "__main__":
    dag.test()
You can then execute the file directly with:
python <dag_file>.py
This method runs your entire DAG in a single serialized Python process, bypassing the scheduler and executor overhead. It's much faster than running tests in a full Airflow environment. Another advantage is its "fail-fast" behavior - it stops immediately upon encountering an error, helping you quickly identify and fix issues.
You can also customize your tests using optional arguments. For example, use execution_date to test specific dates or mark_success_pattern to skip resource-intensive tasks like ExternalTaskSensor or cleanup operations. To identify deprecation warnings before deployment, run your test with the -W default flag:
python -W default your_dag.py
Debug with the DebugExecutor
For those working with older versions of Airflow, the DebugExecutor was once a popular tool for step-by-step debugging. However, as of Airflow 2.5.2, the DebugExecutor is deprecated, and dag.test() is now the standard. If you're still using an older version, you can configure the DebugExecutor by adding the following code to your DAG file:
if __name__ == "__main__":
    dag.clear()
    dag.run()
And setting the environment variable:
AIRFLOW__CORE__EXECUTOR=DebugExecutor
Set Up Local Development Tools
After validating your DAG with dag.test(), modern development tools can further streamline your debugging process. Popular IDEs like PyCharm and VS Code allow you to run dag.test() directly using their "Run" or "Debug" options. Simply include the if __name__ == "__main__" block, and you can use breakpoints to debug visually.
Before running local tests, ensure your environment is set up correctly. This means installing all necessary provider packages and pointing AIRFLOW_HOME to a local metadata database. SQLite is a lightweight and effective option for local testing.
For those using the Astro CLI, you can test your DAGs with a simple command:
astro dev dags test <dag_id>
This Docker-based approach quickly spins up a local Airflow environment, making it easy to test your changes without additional setup.
Step 5: Fix Resource and Scheduler Issues
After validating your DAG locally, it's time to tackle production-specific challenges like resource allocation and scheduler misconfigurations. Even if everything works fine in a local environment, production can introduce issues that weren’t apparent during testing.
Review Scheduler Logs
Scheduler logs are your first stop when diagnosing production issues. These logs are typically stored locally by default but are often forwarded to cloud aggregators like FluentD in production environments.
Certain exit codes can give you clues about the problem. For instance, -9 (SIGKILL) often points to an Out of Memory (OOM) error, while -15 (SIGTERM) usually indicates a DAG run timeout. Refer to the error patterns in Step 2 for additional details.
If your DAG isn’t showing up in the UI, it might be due to parsing or import errors. This could happen if the DAG takes too long to parse. In such cases, consider increasing the core.dagbag_import_timeout or dag_processor.dag_file_processor_timeout settings. For Astro CLI users, you can quickly check the scheduler’s health by running:
astro dev logs -s
Alternatively, you can use:
airflow jobs check --job-type SchedulerJob
.
Tasks stuck in the queued state often signal scheduler resource starvation, while tasks lingering in the scheduled state might indicate heartbeat timeout issues. Here’s a quick reference table for common errors and their fixes:
| Error/State | Likely Cause | Recommended Action |
|---|---|---|
SIGKILL / Exit Code -9 |
Out of Memory (OOM) | Increase memory for scheduler/worker |
SIGTERM / Exit Code -15 |
DAG run timeout | Increase dagrun_timeout or optimize tasks |
Tasks stuck in queued |
Scheduler resource starvation | Increase scheduler CPU/memory or adjust task_queued_timeout |
Tasks stuck in scheduled |
Heartbeat timeout | Check network/DB latency or adjust heartbeat frequency |
| Missing DAG in UI | Parsing/import error | Increase dagbag_import_timeout |
Adjust Resource Allocation
Once you’ve reviewed the scheduler logs, you can tweak resource settings to address bottlenecks. The adjustments will vary depending on the executor you’re using:
- KubernetesExecutor: Increase CPU and memory for individual pods to avoid OOM errors.
- CeleryExecutor: Use the
queueparameter to distribute tasks across specific worker sets.
The parallelism parameter can help control the maximum number of concurrent task instances across all DAGs. If tasks remain queued for too long (default is 600 seconds), you may need to increase the scheduler’s resources or adjust the scheduler.task_queued_timeout setting. For setups with multiple schedulers, adding extra scheduler instances can improve throughput and reduce latency.
You can also refine resource allocation at the DAG and task levels. Use max_active_tasks to limit the number of concurrent tasks for a specific DAG, and max_active_runs to control how many instances of a DAG can run simultaneously. Additionally, the priority_weight parameter helps the scheduler prioritize tasks when resources are limited.
Verify Scheduling Configuration
Resource limits aren’t the only potential roadblock - misconfigured scheduling parameters can also disrupt DAG execution. For example, avoid using datetime.now() for your start_date. Instead, set a fixed date in the past to ensure tasks align correctly with their intervals. If activating a new DAG causes too many runs at once, depleting resources, set catchup=False to process only the latest interval.
Airflow schedules DAG runs after the data interval ends. For instance, a DAG scheduled @daily for January 1, 2026, will actually start running after January 2, 2026, at 12:00:00 AM. Understanding this behavior can save you from scheduling confusion.
If tasks don’t trigger despite available resources, check your concurrency settings. Adjust the max_active_tis_per_dag and max_active_runs parameters to prevent resource overload. For environments with a large number of DAG files, increasing min_file_process_interval and setting file_parsing_sort_mode to modified_time can speed up file discovery.
Conclusion
Debugging Airflow DAG failures doesn't have to feel like an uphill battle if you approach it systematically. By following key steps - like verifying DAG registration, troubleshooting external dependencies, and managing resource allocation - you can streamline the debugging process and keep things under control.
Catching errors early during local testing can save you from costly headaches in production. Interestingly, about 80% of Airflow DAG issues stem from a small set of common problems. By focusing on these core troubleshooting techniques, you'll be able to resolve most of the challenges you encounter.
Leverage tools such as the Astro CLI, dag.test(), and detailed log analysis to get quick, actionable feedback on your changes. When paired with effective resource monitoring and optimized scheduling configurations, these tools transform debugging into a precise and methodical task.
If you're eager to go beyond the basics and refine your skills, consider hands-on training to master Airflow's more advanced orchestration features. The DataExpert.io Academy offers specialized boot camps in data engineering and AI engineering, with practical lessons on tools like Airflow, Databricks, and AWS. With over 250 hours of content and access to a thriving community of 5,800+ data professionals, this academy equips you to confidently manage complex production pipelines and scale your expertise.
FAQs
What are the main reasons why Airflow DAGs fail?
Failures in Airflow DAGs often stem from a handful of recurring issues. For instance, scheduling hiccups - like the scheduler not running, incorrect start dates, or misconfigured schedule intervals - are common culprits. Additionally, syntax errors in the code, dependency mismatches, or resource constraints, such as a lack of available executor slots, frequently cause problems.
External factors can contribute too. Failures in upstream systems, missing data, or network connectivity troubles can disrupt the workflow. To troubleshoot effectively, dive into the task logs for detailed error messages and double-check that all dependencies are properly configured. Regularly analyzing logs and keeping a close eye on dependency setups can go a long way in minimizing DAG failures.
How can I test my Airflow DAGs locally before deploying them?
To test your Airflow DAGs locally, you can make use of the dag.test() method. This handy feature lets you check the syntax and logic of your DAG without the need to deploy it to a production environment. To get started, simply add this snippet to the end of your DAG file:
if __name__ == "__main__":
    dag.test()
Before running the test, you'll need to set up a test environment. Here's how:
- Create a virtual environment:
python -m venv venv-airflow - Activate the environment:
source venv-airflow/bin/activate - Install Airflow and its required dependencies.
Once your environment is set up, you can run your DAG locally. This process helps identify any syntax errors, dependency conflicts, or configuration issues early on, saving you time and reducing the chances of encountering problems in production.
Why isn't my DAG showing up in the Airflow UI?
If your DAG isn’t showing up in the Airflow UI, the first step is to verify that the DAG file is saved in the correct directory defined by the dags_folder configuration. Make sure the file has a .py extension and contains valid Python code - Airflow won’t recognize empty or improperly formatted files.
Next, take a look at the Airflow scheduler logs for any syntax errors or other problems. These logs are usually located in the $AIRFLOW_HOME/logs/scheduler directory. Once you’ve addressed any issues, restart the scheduler by running the airflow scheduler command to ensure it processes the updated files.
If the problem continues, dig deeper into the logs to identify specific error messages. Fixing these errors should make your DAG visible in the Airflow UI.