
Databricks for Anomaly Detection in Data Pipelines
Anomaly detection in data pipelines is crucial for identifying issues like fraud, system failures, or data corruption. Databricks simplifies this process with automated tools that monitor data quality and flag irregularities in real-time. Here's a quick overview of how it works:
-
Key Metrics Monitored:
- Freshness: Tracks how up-to-date a table is based on historical trends.
- Completeness: Estimates expected row counts within a time frame to detect missing data.
- Dynamic Approach: Databricks uses historical data to define "normal" patterns, eliminating the need for manual thresholds.
-
Tools Involved:
- Delta Live Tables (DLT): Builds and manages data pipelines.
- Unity Catalog: Centralizes data governance and monitoring.
- MLflow: Tracks and deploys machine learning models.
- Real-World Example: In February 2026, Databricks helped an online brokerage detect a 60–80% drop in order volumes caused by a UI bug, allowing a quick resolution.
To implement anomaly detection, you’ll need skills in Python, SQL, and Databricks tools through a data engineering mastery course. Set up your workspace with Unity Catalog, enable monitoring features, and use machine learning algorithms like Isolation Forest for anomaly detection. Once deployed, regular retraining and monitoring ensure accuracy and reliability.
Databricks integrates data engineering, machine learning, and governance into one platform, making anomaly detection efficient and scalable. Start by enabling schema-level monitoring in Unity Catalog and building pipelines with Delta Live Tables for real-time insights.
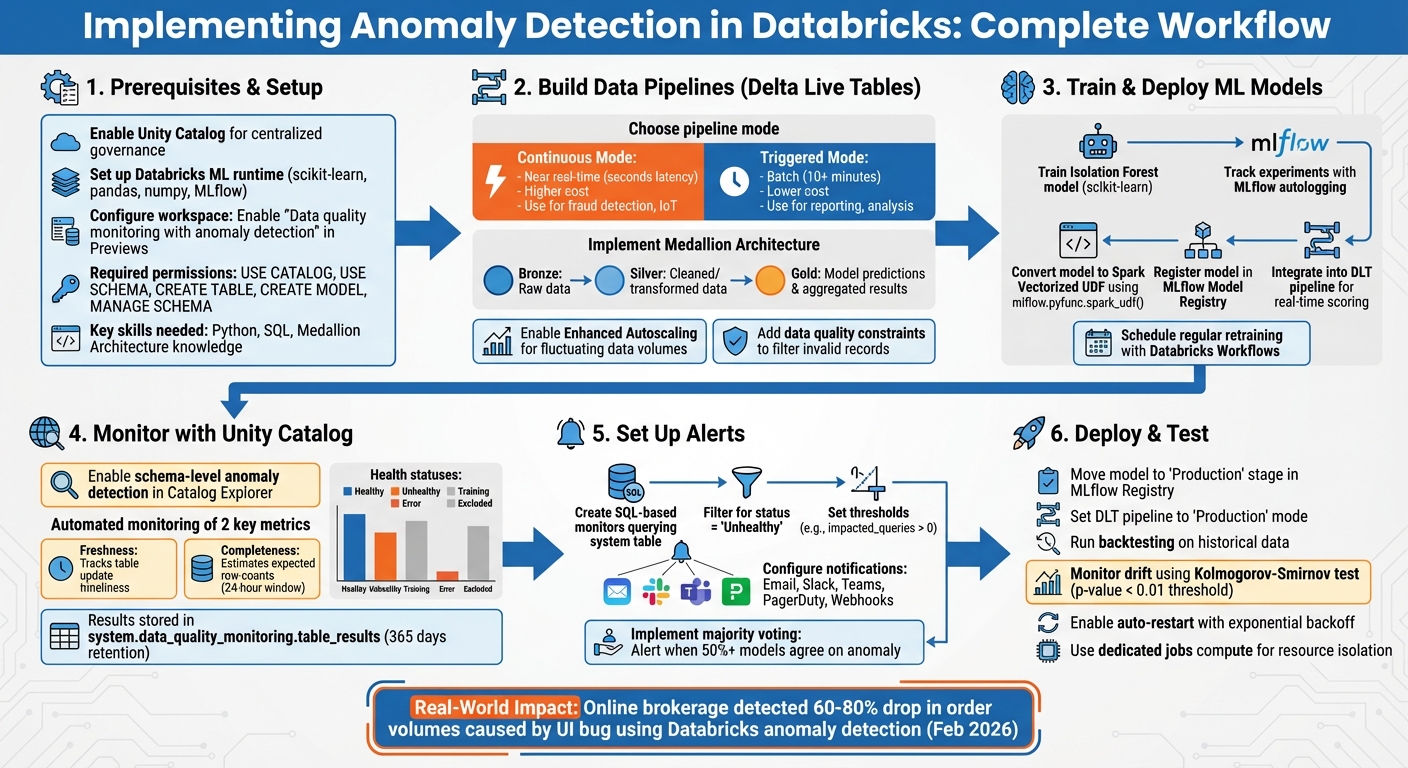
Databricks Anomaly Detection Implementation Workflow
Anomaly detection on streaming data using Azure Databricks
sbb-itb-61a6e59
Prerequisites for Setting Up Anomaly Detection in Databricks
Before diving into anomaly detection within Databricks, it's crucial to set up your environment properly. This ensures smooth execution of pipeline building, model deployment, and monitoring processes.
Setting Up Your Databricks Workspace and Cluster
Start by enabling Unity Catalog for centralized data governance, which plays a key role in anomaly detection workflows. Most Unity Catalog environments come with serverless compute enabled by default, so you’re likely good to go on that front.
For machine learning tasks, use clusters running the Databricks Machine Learning (ML) runtime. This runtime is specifically designed for tasks like training an Isolation Forest model and includes pre-installed libraries such as scikit-learn, pandas, numpy, and MLflow. As Databricks puts it:
"When doing anything machine learning related on Databricks, using clusters with the Machine Learning (ML) runtime is a must."
If you're working with Delta Live Tables (DLT) pipelines, enable autoscaling to handle varying data loads. Choose Continuous Mode for near real-time anomaly detection or Triggered Mode for batch processing at set intervals, such as every 10 minutes.
For workspaces using a Secure Egress Gateway (SEG), make sure that pypi.org is added to the allowed domains. This ensures you can install additional libraries as needed. In production environments, it’s best to run pipelines using service principals instead of individual user accounts for added security and reliability.
Workspace admins also need to enable the "Data quality monitoring with anomaly detection" feature in the workspace settings under the Previews page. Once activated, the Anomaly Detection option will appear in the Advanced section of your schema's Details tab in Catalog Explorer.
Required Skills and Tools
To make the most of these features, you'll need a mix of technical skills and familiarity with Databricks tools:
- Python: Essential for training models.
- SQL: Key for transforming data.
- Medallion Architecture: Understanding the layers (Bronze, Silver, Gold tables) is crucial.
Knowledge of Databricks features such as Delta Live Tables (for declarative pipelines), Unity Catalog (for governance and model registry), and MLflow (for experiment tracking and model versioning) is also vital. For more advanced tasks, experience with tools like Hyperopt or Optuna can help fine-tune hyperparameters.
On the permissions side, ensure you have the following privileges within your target schema:
- USE CATALOG, USE SCHEMA, CREATE TABLE, and CREATE MODEL for general operations.
- MANAGE SCHEMA or MANAGE CATALOG for enabling schema-level monitoring.
- Access to the
system.data_quality_monitoring.table_resultstable for viewing metastore-level quality results.
If you’re looking to sharpen these skills, check out the hands-on training programs available at DataExpert.io Academy (https://dataexpert.io). These resources can help you gain practical experience and deepen your understanding.
Building Data Pipelines with Delta Live Tables
Delta Live Tables (DLT) offers a straightforward way to design data pipelines using a declarative framework. With DLT, you can define your data transformations in either SQL or Python, while the platform takes care of orchestration, cluster management, and handling data dependencies automatically.
Many anomaly detection pipelines rely on the Medallion Architecture. In this setup, Bronze tables hold raw, unprocessed data, Silver tables store cleaned and transformed data, and Gold tables house model predictions and aggregated results. This layered approach not only ensures clear data lineage but also makes it easier to diagnose issues when anomalies arise [22, 24].
Creating Your First Delta Live Tables Pipeline
When building anomaly detection pipelines, you can choose between two modes: Continuous Mode and Triggered Mode.
- Continuous Mode is ideal for scenarios requiring low-latency detection, such as fraud monitoring or real-time IoT applications.
- Triggered Mode, on the other hand, processes data at scheduled intervals, making it better suited for tasks like daily reporting or trend analysis. This mode also helps reduce costs since clusters shut down after each task [12, 24].
| Feature | Continuous Mode | Triggered Mode |
|---|---|---|
| Latency | Near real-time (seconds) | Batch (10+ minutes) |
| Cost | Higher (always-on compute) | Lower (compute stops post-task) |
| Use Case | Fraud detection, IoT monitoring | Historical analysis, reporting |
To ingest data, use Auto Loader, which simplifies loading from cloud storage systems like S3, ADLS, or GCS. Auto Loader can automatically detect schema changes and adapt accordingly. For event-driven sources like Kafka or Kinesis, the recommended method is to use spark.readStream in Python.
To handle fluctuating data volumes efficiently, enable Enhanced Autoscaling in your pipeline settings. This feature adjusts resources dynamically, helping to save costs during periods of low activity. During development, use "Development" mode for testing, then switch to "Production" mode to enable features like automated retries and recovery [12, 24].
You can also add data quality checks using expectations. For example, the following constraint filters out problematic records:
CONSTRAINT valid_data EXPECT (condition) ON VIOLATION DROP ROW.
This is particularly useful for removing invalid data, such as rows with null timestamps or negative sensor readings, which could distort anomaly detection results [12, 28].
With this foundation in place, the next step is understanding how DLT handles both streaming and batch data sources for anomaly detection.
Handling Real-Time and Batch Data
Delta Live Tables can seamlessly manage both streaming and batch data sources. For instance, consider a high-frequency bike-sharing application that generates approximately 1,440 JSON files and 1.7 million rows daily. Over a year, this scales to over 520,000 files and 630 million rows.
When working with Kafka, where messages may expire after seven days, set pipelines.reset.allowed=false. This prevents DLT from attempting to backfill data that no longer exists during a full refresh. Additionally, in production environments, configure Kafka with startingOffsets = "latest" to minimize latency and reduce memory usage.
DLT also simplifies tasks like checkpointing and state management, ensuring exactly-once processing. To maintain performance and control storage costs, schedule regular maintenance tasks such as running OPTIMIZE and VACUUM operations every 24 hours [24, 28].
Once your machine learning model is ready, you can register it as a Spark User Defined Function (UDF). This allows you to integrate model scoring directly into your SQL or Python DLT queries, enabling near real-time anomaly detection.
Training and Deploying Machine Learning Models for Anomaly Detection
After setting up Delta Live Tables, the next step is to bring anomaly detection to life with a machine learning model. The goal here is to train a model capable of identifying anomalies in your data. The Databricks Machine Learning runtime simplifies this process by including pre-installed tools like scikit-learn.
Anomaly detection typically uses unsupervised learning because anomalies don’t come with predefined labels. The model learns the usual patterns in your data and flags anything that deviates significantly from those patterns.
Training an Isolation Forest Model
The Isolation Forest algorithm works on the principle that anomalies are easier to isolate with fewer splits. This makes it well-suited for detecting anomalies across multiple dimensions, though it can take about twice as long to execute compared to simpler statistical methods like the z-score.
To streamline the process, use MLflow to automatically track your experiments. By enabling MLflow's autologging feature, you can keep a detailed record of model parameters and metrics right in your notebook.
For larger datasets, you can wrap your scikit-learn model in a Pandas UDF to perform distributed inference efficiently. Although Spark MLlib doesn’t have a built-in Isolation Forest implementation, this method allows you to apply the model seamlessly to massive DataFrames. Additionally, the PyOD library - boasting over 10 million downloads - offers access to more than 40 anomaly detection algorithms that integrate easily with Databricks.
This setup ensures a smooth transition for your model into the Delta Live Tables pipeline.
Integrating the Model into Delta Live Tables
Once the model is trained, you can embed it directly into your streaming and batch pipelines. By using mlflow.pyfunc.spark_udf(), you can convert your trained model into a Spark Vectorized UDF. This enables you to call the model directly in SQL queries.
The Databricks team highlights:
One could build a near-real-time anomaly detection pipeline entirely in SQL, with Python solely being used to train the machine learning model.
To implement this, load the model in a Python notebook library, register it as a UDF, and then reference it in your SQL-based streaming live tables for inference. This approach simplifies anomaly detection in production pipelines, allowing for real-time insights without complicated code.
Since anomaly patterns - such as fraud behaviors - can shift over time, schedule regular retraining jobs using Databricks Workflows. To boost reliability, consider running multiple models simultaneously and using a majority-vote system to reduce false positives. For example, you could flag an anomaly only when at least half of your models agree on the detection.
Using Unity Catalog for Data Quality Monitoring
With anomaly detection models in place, Unity Catalog simplifies ongoing data quality monitoring. By activating anomaly detection in Delta Live Tables, you can centralize oversight across your schema. Forget manual checks - once enabled, Databricks automatically tracks table freshness and completeness at the schema level.
Databricks explains:
Anomaly detection enables you to monitor data quality across all tables in a schema. By analyzing historical patterns, Databricks automatically evaluates the completeness and freshness of each table.
The system uses intelligent scanning to focus on frequently accessed tables, helping to manage compute costs efficiently. All monitoring results are stored in the system.data_quality_monitoring.table_results system table, and this comes at no extra charge. This capability works seamlessly with earlier pipeline configurations.
Enabling Schema-Level Monitoring
To enable monitoring, go to your schema in Catalog Explorer, open the Details section, click Enable, and toggle on Anomaly Detection. You’ll need MANAGE SCHEMA or MANAGE CATALOG privileges to set this up. Data consumers, however, only need SELECT or BROWSE privileges to view health metrics.
Databricks monitors two key metrics:
- Freshness: Predicts when the next commit should occur based on historical trends.
- Completeness: Estimates the expected range of rows written within the last 24 hours.
If a commit happens much later than expected or the row count falls short, the table is flagged as unhealthy. For more detailed checks, the Percent null beta feature can be enabled to identify columns with unexpectedly high null values over a 24-hour period.
If some tables don’t require monitoring, you can exclude them using the Update Monitor API by adding them to the excluded_table_full_names parameter. Note that smart scanning might delay health indicators for up to two weeks for skipped tables during the initial scan.
Reviewing Results in Catalog Explorer
Once monitoring is active, results appear directly in Catalog Explorer. Health indicators, such as Healthy, Unhealthy, Training, Error, or Excluded, are displayed on overview pages. Meanwhile, the system table logs metadata like status, freshness.status, completeness.status, and root_cause_analysis for deeper analysis. The Quality tab provides detailed graphs, showing predicted versus observed values for freshness and completeness over the past week.
The downstream_impact column quantifies the severity of issues on a scale from 1 to 4, with higher numbers signaling greater disruption to downstream tables and queries.
Jake Roussis, Lead Data Engineer at Alinta Energy, highlighted the benefits:
Our goal has always been for our data to tell us when there is a problem. Databricks' Data Quality Monitoring finally does that through its AI-driven approach. It's integrated seamlessly into the UI, monitoring all our tables with a hands-off, no-configuration approach.
For a broader view, you can import the metastore-quality-dashboard.lvdash.json template to create a centralized dashboard. This allows you to monitor quality results across your entire metastore. Since the system table includes data samples from the entire metastore, ensure access is restricted to authorized users only.
Setting Up Monitors and Alerts for Anomalies
Once Unity Catalog monitoring is active, the next step is to set up automated alerts to notify your team about anomalies. Use the system.data_quality_monitoring.table_results table as the foundation for creating custom alert queries. By default, only account admins can access this table, so administrators need to grant SELECT privileges to the users responsible for configuring alerts.
Creating SQL-Based Monitors for Delta Tables
With Unity Catalog capturing monitoring data, you can create SQL-based monitors to identify anomalies in real time. Head to the Alerts section in Databricks SQL and click Create Alert. Write a query that filters the monitoring table for status = 'Unhealthy', which will highlight issues like data freshness and completeness. Use a Common Table Expression (CTE) to focus on recent results by filtering for evaluated_at >= current_timestamp() - INTERVAL 6 HOURS, ensuring the query captures only recent anomalies.
To avoid overwhelming your team with excessive notifications, include parameters like :min_tables_affected in your query. This ensures alerts are only triggered when a significant number of downstream queries are impacted. Databricks retains 365 days of monitoring history, offering a reliable baseline for analyzing trends. According to Databricks documentation:
Anomaly detection does not modify any tables it monitors, nor does it add overhead to any jobs that populate these tables.
Once you've identified the anomalies through your query, you can move forward with configuring alerts tailored to your team's needs.
Configuring Alerts for Detected Anomalies
Set up the alert by defining a Condition and Threshold - for instance, triggering the alert when impacted_queries exceeds 0. Align the alert's Schedule with your pipeline's cadence, and note that alerts can run as frequently as every minute. Adjust the Notification Frequency to either send a one-time alert or resend alerts periodically until the issue is resolved.
Databricks supports a variety of notification methods, including Email, Slack, Microsoft Teams, PagerDuty, and custom Webhooks. In the "Advanced" alert settings, you can use HTML templates to include specific details like {{full_table_name}}, {{commit_actual}}, and {{completeness_actual}} in the notifications. This ensures your team gets all the necessary context without sifting through logs.
For more complex pipelines, you can implement majority voting by configuring alerts to trigger only when a certain percentage - commonly 50% - of models agree on the presence of an anomaly. This setup integrates seamlessly into your anomaly detection pipeline, helping your team respond proactively to data quality issues.
Deploying and Testing the Complete Pipeline
Once your anomaly detection pipeline is ready, it’s time to deploy it into production. Start by using the MLflow Model Registry to move your trained model - such as an Isolation Forest - to the "Production" stage. This process can be automated using the MLflow REST API. Then, create a Delta Live Tables (DLT) pipeline and set its mode to "Production" to enable automated retries and ensure high availability.
Next, register the production model as a vectorized User Defined Function (UDF) within the DLT pipeline. This allows for distributed, near real-time scoring of incoming data. To maintain data quality, enforce DLT expectations like CONSTRAINT valid_reading EXPECT (val IS NOT NULL) ON VIOLATION DROP ROW, which automatically filters out low-quality data. For near real-time anomaly detection, run the DLT pipeline in "Continuous" mode. If your use case involves batch processing, opt for "Triggered" mode with intervals as short as 10 minutes. This setup integrates seamlessly with MLflow model management and your DLT pipeline.
Once deployed, the next step is to ensure the pipeline performs as expected.
Testing Anomaly Detection Accuracy
Backtesting is essential for evaluating the accuracy of your anomaly detection model and identifying potential drift. Databricks allows you to run monitors on historical data, simulating table quality checks as if monitoring had been active two weeks earlier. Regularly analyze the statistical properties and distributions of features, labels, and predictions to catch data or concept drift. As Databricks notes:
Change is the only constant in life. This also holds true for machine learning models, as over time they could deteriorate in their accuracy or in their predictive power, often referred to as model drift.
To detect drift, apply statistical tests like the Kolmogorov-Smirnov (KS) test, which compares new data distributions with the original training data. If the p-value drops below a set threshold (e.g., 0.01), an alert can be triggered to investigate potential issues. These anomalies should be reviewed by site reliability or quality managers to determine whether they stem from intentional system changes, such as equipment updates, or from unintentional failures. Additionally, Unity Catalog provides health statuses - like "Healthy", "Unhealthy", "Training", and "Error" - to offer immediate insights into the pipeline’s state.
Once accuracy is validated, shift your focus to ensuring production reliability.
Production Reliability Best Practices
Reliability in production requires careful planning and configuration. Begin by leveraging the DLT settings you’ve already established to implement these best practices. Use dedicated jobs compute for production workloads to ensure resource isolation and optimize costs. Set up streaming jobs to restart automatically with exponential backoff to handle unexpected interruptions. For efficient data processing, use Auto Loader, which supports exactly-once processing and automatic schema evolution.
To keep your model up to date, schedule retraining jobs using Databricks Workflows. This ensures your Isolation Forest or other algorithms stay aligned with evolving data patterns. Configure DLT clusters with autoscaling capabilities to handle fluctuating data loads without causing bottlenecks. If you’re running multiple streaming queries within a single task, use scheduler pools to allocate compute resources fairly and avoid delays. Additionally, monitor metrics like num_queries_on_affected_tables to prioritize debugging efforts for critical issues.
Conclusion: Summary and Next Steps
This framework provides a complete guide for anomaly detection in Databricks, covering everything from setting up Delta Live Tables and training Isolation Forest models to deploying production pipelines with Unity Catalog monitoring. By integrating data engineering, machine learning, and governance into a single workflow, Databricks offers a streamlined approach to anomaly detection. The next step is to apply these insights in your production environment.
Start by enabling schema-level monitoring in Unity Catalog. Simply go to the "Details" tab of any schema in Catalog Explorer and toggle on Anomaly Detection. This feature will automatically monitor table freshness and completeness.
To improve detection accuracy and minimize false positives, explore multi-model ensembles within a "weak learner" framework. As the Databricks team explains:
Simplicity has its price, and each statistical model comes with its own set of strengths and weaknesses. However, applying few techniques in parallel and aggregating the detection, overcomes individual weaknesses and dramatically improves robustness of the entire system.
Use at least two models - such as Prophet, Robust PCA, or Rolling Median Absolute Deviation - to validate anomalies before flagging them.
For practical application, take advantage of solution accelerators like the credit card fraud detection accelerator. To deepen your understanding, refer to "The Big Book of MLOps", which offers valuable insights into managing data pipelines and addressing model drift using DevOps practices. Automate model retraining with Databricks Workflows and set up SQL alerts for real-time anomaly notifications.
If you're looking to sharpen your skills, DataExpert.io Academy offers boot camps in data engineering, analytics engineering, and AI engineering. These programs provide hands-on training with tools like Databricks, MLflow, and Delta Live Tables, along with capstone projects to help you build production-ready anomaly detection systems from scratch.
FAQs
When should I use Continuous mode vs Triggered mode in DLT?
Triggered mode works well for scheduled updates. Whether you need updates every 10 minutes, hourly, or daily, this mode processes data based on its state at the start of each update. Once it refreshes the tables, it stops running until the next scheduled time.
Continuous mode, on the other hand, is designed for real-time or near-real-time processing. It runs non-stop, keeping an eye on changes and updating dependent Delta tables whenever new data comes in. This ensures your data stays current and ready for operational needs.
How can I reduce false positives in anomaly detection?
To cut down on false positives, tweak your anomaly detection model by adjusting thresholds or scoring criteria. This helps distinguish actual anomalies from regular variations more effectively. Tools like Databricks' anomaly detection alerts can assist in fine-tuning sensitivity and filtering criteria. Make it a habit to regularly review high-scoring anomalies, validate your models, and establish continuous feedback loops. This approach improves precision without compromising detection accuracy.
What permissions do I need to enable Unity Catalog monitoring and alerts?
To set up Unity Catalog monitoring and alerts for anomaly detection in Databricks, you’ll need MANAGE SCHEMA or MANAGE CATALOG privileges. By default, only account admins can access the system.data_quality_monitoring.table_results system table used for alerts. If other users need access, an admin must grant them the required permissions. Make sure these privileges are assigned properly to configure monitoring and alerts without issues.