
Databricks for Financial Market Analysis
Databricks simplifies financial market analysis by combining real-time data processing with historical insights. Its Lakehouse architecture integrates streaming and batch data, enabling faster decision-making for tasks like stock price analysis, predictive modeling, and market surveillance. Key features include:
- Real-time processing: Latency as low as 5 milliseconds for live market data.
- Time-series tools: Specialized libraries for VWAP calculations, as-of joins, and rolling aggregations.
- Unified governance: Centralized data and AI management with Unity Catalog.
- Efficient pipelines: Delta Live Tables automate workflows and manage out-of-order data.
- Scalable analytics: Process petabytes of tick data using Spark and GPU clusters.
Databricks also supports collaborative development with multi-language notebooks and pre-built solutions for faster implementation. By integrating streaming and historical data, it empowers financial institutions to analyze markets efficiently and deliver actionable insights.
Setting Up a Databricks Workspace for Financial Analysis
Configuring Your Databricks Workspace
Choosing the right compute resources is key to a smooth workflow. For exploratory analysis and development, all-purpose clusters are a good fit. For production tasks, however, job clusters or serverless compute are more efficient options.
To ensure proper data governance, leverage Unity Catalog and Volumes. These tools help manage access to financial data stored in cloud object storage, keeping sensitive market information secure. When working with event-time data, enforce strict TimestampType schemas. This step is critical for tasks like merging trades and quotes to calculate the National Best Bid and Offer (NBBO).
For data ingestion, Auto Loader (cloudFiles) is a reliable choice for incremental tick data ingestion. If you're working with low-latency market feeds, standard connectors for tools like Kafka or Kinesis are ideal. Python users familiar with pandas can take advantage of the pandas API on Spark (formerly Koalas) to scale time-series workflows without rewriting existing code. For local development and debugging, setting up Databricks Connect with IDEs like PyCharm can streamline your process.
To ensure exactly-once processing for streaming data, always define a unique checkpointLocation for every streaming writer. Convert your financial datasets to Delta format - its columnar storage design supports efficient interactive time-series queries while offering built-in data quality features.
These configurations are essential for low-latency performance and accurate real-time market insights. Once your workspace is set up, the next step is optimizing cluster performance for streaming workloads.
Optimizing Clusters for Streaming Workloads
For production streaming tasks, it's best to use jobs compute instead of all-purpose clusters. Schedule these jobs in "Continuous" mode to ensure the stream automatically restarts after a failure and maintains low latency. To avoid unnecessary overhead in production, remove interactive calls like display() and count().
If you're running stateful queries - such as moving averages or windowed aggregations - configure the RocksDB state store to handle large state sizes efficiently. Fine-tune spark.sql.shuffle.partitions to achieve task sizes between 128–200 MB. Additionally, enable delta.autoOptimize.optimizeWrite and delta.autoOptimize.autoCompact to handle small files automatically.
When running multiple streaming queries on the same cluster, use scheduler pools to allocate resources fairly. This prevents one query from monopolizing resources and ensures balanced performance across tasks. For faster downstream analysis, apply Z-Ordering to Delta tables, especially on high-cardinality columns like ticker_symbol that are frequently used in filters.
Building Real-Time Trading Dashboards With DLT and Databricks Apps
Ingesting and Processing Financial Market Data
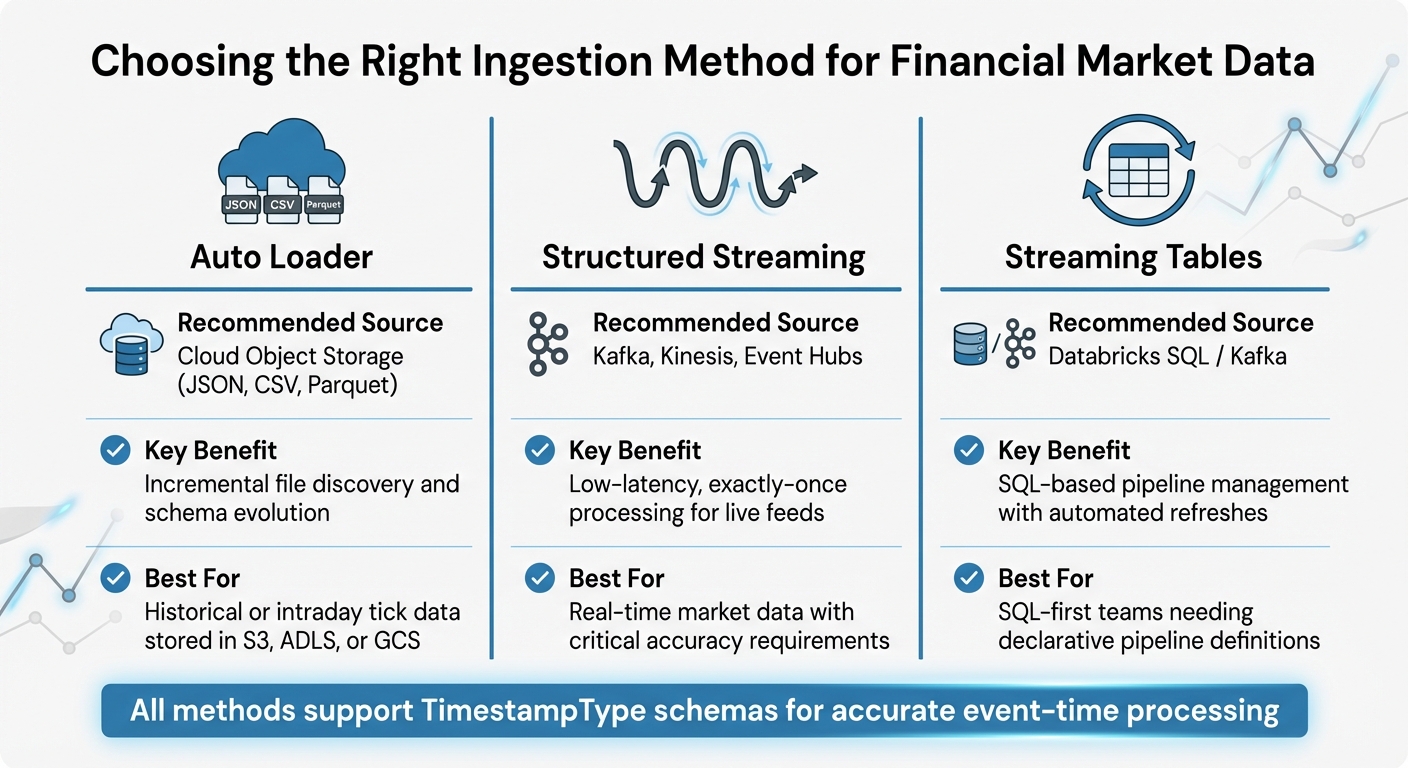
Databricks Financial Data Ingestion Methods Comparison
Ingesting Real-Time Stock Prices
To bring in live market data, Spark Structured Streaming is a solid choice for integrating with sources like Kafka, Kinesis, or Azure Event Hubs. It ensures exactly-once processing, which is critical when dealing with real-time financial data.
For historical or intraday tick data stored in cloud object storage like S3, ADLS, or GCS, Auto Loader can handle incremental ingestion of files in formats like JSON, CSV, or Parquet. During this process, assign a TimestampType to standardize event times across multiple feeds. This step is key when merging trades and quotes for downstream analysis.
Sensitive API keys, such as those needed for accessing specialized data sources like Bloomberg, can be securely stored using Databricks Secrets. Additionally, Databricks offers solution accelerators with pre-built notebooks tailored for ingesting data from platforms like the Bloomberg API, simplifying the setup.
Building Batch and Streaming Pipelines
Once raw market data is ingested, the next step is structuring pipelines to transform it into insights.
A good approach is to follow the Medallion Architecture. Start by storing raw data in Bronze tables, then clean and refine it into Silver tables. This layered structure ensures a smooth transition from raw data to actionable business insights.
Delta Live Tables (DLT) can automate complex workflows and manage dependencies within these pipelines. For streaming tasks, the availableNow trigger is particularly useful - it processes all available data and then shuts down the cluster, combining the efficiency of streaming logic with the cost benefits of batch processing. Be sure to define unique checkpoint locations for fault tolerance.
For data sourced from operational databases, the APPLY CHANGES INTO API in DLT is ideal for handling Change Data Capture (CDC). This method supports both SCD Type 1 and Type 2 updates and automatically manages out-of-order or late-arriving data. To perform time-series analysis, use window functions like last() to execute as-of joins, matching trades with the most recent quotes at the time of execution.
| Ingestion Method | Recommended Source | Key Benefit |
|---|---|---|
| Auto Loader | Cloud Object Storage (JSON, CSV, Parquet) | Incremental file discovery and schema evolution |
| Structured Streaming | Kafka, Kinesis, Event Hubs | Low-latency, exactly-once processing for live feeds |
| Streaming Tables | Databricks SQL / Kafka | SQL-based pipeline management with automated refreshes |
Cleaning and Transforming Financial Data
High-frequency tick data often contains duplicate entries for the same timestamp. To address this, use groupby with a max aggregation to eliminate duplicates and ensure only the most reliable data is retained. For irregular time series, the Tempo library (an open-source tool from Databricks Labs) can effectively handle tasks like as-of joins, resampling, and rolling aggregations.
Data quality is crucial, especially in financial applications. Use Delta Live Tables to enforce quality constraints, such as IS NOT NULL, and apply actions like expect_or_drop or expect_or_fail. These safeguards are critical for maintaining compliance and ensuring accurate market surveillance.
During data transformation, calculate advanced financial metrics to enrich the raw data. Metrics like Volume-Weighted Average Price (VWAP), Exponential Moving Averages, and slippage calculations provide deeper insights for predictive modeling. For large datasets - such as six months of tick data - GPU-managed clusters with gpu_hist can cut costs by 2.65 times and reduce runtime by 2.27 times.
For data scientists accustomed to pandas, the pandas API on Spark (formerly Koalas) offers a way to scale workflows to billions of rows. This scalability can uncover patterns such as market manipulation, which might otherwise remain hidden in smaller datasets.
These transformations set the stage for building predictive models that can drive actionable insights in financial markets.
Running Real-Time Analysis with Databricks
Creating Spark SQL Views for Analysis
Once your data pipelines are in place, Spark SQL views allow you to perform real-time queries on unified datasets. By using createOrReplaceTempView on a streaming DataFrame, you can query live market feeds just as you would with static tables. This method combines streaming and historical data analysis at high speeds while ensuring transactional consistency with Delta Lake.
For example, calculating complex financial indicators becomes much easier with views. You can join live price streams with fundamental data tables to compute metrics like price-to-earnings (P/E) ratios in real time. Aggregate queries, such as AVG(close) GROUP BY ticker, can run efficiently at scale because Structured Streaming manages state for ticker symbols seamlessly.
"Databricks Delta, along with Structured Streaming, makes it possible to analyze streaming and historical data together at data warehouse speeds." - Databricks
If your team prefers a SQL-only approach, tools like Delta Live Tables (DLT) and Lakeflow Spark offer declarative pipelines. By using CREATE STREAMING TABLE, you can handle incremental updates without manually coding low-level ETL processes. This allows you to focus on defining what analysis is needed without worrying about how to implement it. In high-volume scenarios, these systems can handle over 1,440 files and around 1.7 million new rows daily, adding up to more than 630 million rows annually.
Running Streaming Queries on Delta Tables
Once live views are set up, Delta tables come into play to deliver strong streaming query performance. Delta tables ensure exactly-once processing through transaction logs and checkpoints, even when handling concurrent streams or batch jobs. You can query live data directly using statements like SELECT * FROM STREAM table_name.
For fault tolerance, make sure to configure a unique checkpointLocation as outlined in the setup instructions. When working with Delta tables that include updates or deletes, use the skipChangeCommits option to avoid stream interruptions. For initial data loads, you can specify startingVersion or startingTimestamp to process data from a defined point.
To optimize resource usage, control micro-batch sizes with options like maxFilesPerTrigger and maxBytesPerTrigger. For tasks like upserting stock prices, the foreachBatch function with idempotent MERGE statements is highly effective.
Using the TRIGGER ON UPDATE clause ensures streaming tables refresh automatically whenever upstream data changes. The minimum trigger interval is one minute, and Databricks performs routine maintenance - such as OPTIMIZE and VACUUM operations - every 24 hours to maintain performance and cost efficiency.
For scenarios requiring ultra-low latency, such as fraud detection or high-frequency trading, Real-time mode can reduce end-to-end latency to as low as 5 milliseconds. To achieve this, configure RocksDB as the state store and enable asynchronous state checkpointing. This setup is particularly useful for stateful queries like tracking moving averages or cumulative volume metrics. To avoid scheduling delays in Real-time mode, ensure your cluster has enough task slots to handle all query stages.
sbb-itb-61a6e59
Building Predictive Models for Financial Insights
Feature Engineering with Financial Data
Once your datasets are cleaned and enriched, the next step is advanced feature engineering to shape raw market data into something your predictive models can use. This process focuses on creating features that accurately reflect market behavior. Databricks leverages Apache Spark to handle time-series operations across hundreds of thousands of tickers, ensuring scalability.
As-of joins are a key technique to avoid look-ahead bias. This method merges trade data with National Best Bid Offer (NBBO) quotes, ensuring the model uses the latest quote available at the exact timestamp of each trade. Using Spark's last windowing function, you can capture the most recent non-null quote at the time of execution, giving your model an accurate view of the market's state.
For high-frequency data, de-duplication is essential to avoid skewed results. When multiple quotes share the same timestamp, you can apply groupby and max functions to retain only the most relevant depth values. Additionally, calculating metrics like Volume-Weighted Average Price (VWAP) helps spot overbought or oversold conditions, which are critical for market analysis.
The pandas API on Spark (formerly Koalas) allows data scientists to scale familiar pandas operations to massive datasets. This includes tasks like calculating rolling averages or Price/Earnings ratios. To ensure data quality, you can use the Interquartile Range (IQR) method to filter outliers and manage missing data through imputation or interpolation.
Engineered features should be stored in the Databricks Feature Store, which ensures consistency between training and real-time predictions. By centralizing feature logic, you avoid offline/online skew and maintain alignment throughout the modeling process.
With these features in place, you're ready to move on to training predictive models.
Training Predictive Models
Once your features are ready, you can start training models. Databricks AutoML simplifies the process by automating model selection, while libraries like scikit-learn allow for more tailored approaches, such as gradient boosting. For time-series forecasting, tools like Prophet handle seasonality and holiday effects, while LSTMs are better suited for capturing complex, long-term dependencies.
To streamline the process, enable MLflow autologging with mlflow.autolog() at the start of your notebook. This automatically tracks key metrics - like RMSE, MAE, and AUC - for every training run, making it easier to compare model versions.
For hyperparameter tuning, Hyperopt with SparkTrials lets you run parallel sweeps across Spark workers. By setting max_evals to values like 32, you can efficiently find the best algorithm settings while cutting down tuning time. A standard 80/20 train-test split ensures your model is validated before deployment.
Evaluating and Improving Models
After training, thorough evaluation is critical to ensure your models deliver reliable insights. The choice of evaluation metrics depends on your use case. For example, RMSE (Root Mean Squared Error) is useful for highlighting large errors but can be sensitive to outliers. On the other hand, MAE (Mean Absolute Error) offers a straightforward average of prediction errors. For classification tasks, such as predicting stock price movements, AUC (Area Under the Curve) gauges the quality of probability estimates.
To manage model versions and governance, use Unity Catalog as a centralized registry. Configuring MLflow with mlflow.set_registry_uri("databricks-uc") ensures that models are tracked from experimentation to production. This setup also allows teams to revert to earlier versions if performance issues arise.
Continuous improvement is key. Compare MLflow training runs to identify which feature combinations or hyperparameter settings yield the best results. Tracking preprocessing steps - like outlier thresholds or imputation methods - alongside your models ensures every experiment is reproducible.
"The battle over alpha is no longer fought with 'FLOPS' but rather with 'bytes'. The ability of an investment firm to ingest and process large volumes of diverse datasets is essential for greater yields." - Databricks
Visualizing Financial Insights with Databricks Dashboards
Building Dashboards in Databricks
After completing predictive modeling, the next step is to make those insights actionable by visualizing them. Interactive, real-time dashboards in Databricks are a powerful way to present insights, offering a clear and dynamic view of market conditions to both analysts and executives .
Start by defining your dataset using SQL queries or Unity Catalog tables . Then, choose visualization types that best represent your financial data. For instance, line and area charts are ideal for tracking stock price trends over time. If you need to compare metrics on different scales - like stock prices in dollars versus trading volume in millions - dual-axis charts ensure both datasets are easy to interpret .
For profit and loss statements or analyzing cumulative gains and losses, waterfall charts are a great choice . When summarizing key metrics for executives, single-metric visualizations can highlight critical data points, such as the current stock price along with daily or hourly changes . To handle more detailed analysis, pivot tables can aggregate and organize complex financial records into a clear, tabular format .
The Databricks Assistant makes dashboard creation faster by turning natural language prompts into visualizations. For example, typing "Bar chart of average trading volume over time" generates the chart without needing manual setup . You can also add interactive features like date range pickers or dropdown menus to keep dashboards user-friendly . For automated updates, the "Schedule" feature allows dashboards to refresh at specific intervals - like hourly - and can even send PDF snapshots via email .
These dashboards are more than just visual tools; they create a foundation for interactive and automated insights.
Generating Automated Insights
Static visualizations are valuable, but interactive tools take data exploration to the next level. With AI/BI Genie, stakeholders can ask natural language questions and instantly get answers from financial data . This tool translates conversational queries into SQL, making it accessible for non-technical users. For example, a portfolio manager might ask, "Which stocks had the highest volatility last week?" and receive both the data and a clear explanation in response.
"AI/BI automatically understands [data] structure, usage, and semantics, making it simple for BI developers to quickly build and share dashboards using Databricks Assistant." - Databricks
Adding a Genie space alongside your dashboards gives users the flexibility to explore additional insights beyond standard widgets . This self-service capability reduces the workload for data teams while allowing decision-makers to act on real-time information. When sharing dashboards, the "Share with data permissions" feature ensures stakeholders only access data aligned with their authorization levels .
Conclusion
Databricks brings together streaming, AI, and reporting to deliver real-time market insights through its unified lakehouse architecture. By eliminating outdated insights and drastically shortening the time from research to production-ready models - from months to mere minutes - it transforms how financial institutions operate.
The platform is built to handle high-speed financial data at scale, automating ingestion processes, maintaining data quality with built-in validation, and ensuring compliance through robust governance tools. With Delta Lake, it supports ACID transactions while seamlessly integrating streaming and historical data.
As financial institutions move toward data-first operating models, Databricks plays a key role in this shift. For example, one major bank reduced development time by five weeks thanks to the platform's multi-language support. Whether managing massive historical datasets or processing real-time market feeds, Databricks' scalable time-series analytics and collaborative notebooks speed up hypothesis testing and model refinement.
From building real-time risk models to identifying market manipulation or delivering tailored insights to portfolio managers, Databricks equips firms with the tools to turn financial data into actionable intelligence. This leads to quicker decisions, more precise models, and the flexibility to respond to changing market conditions.
For practical training and expert resources on using these tools for financial market analysis, check out the specialized programs at DataExpert.io Academy (https://dataexpert.io).
FAQs
How does Databricks integrate real-time and historical data for financial market analysis?
Databricks brings together real-time and historical data to streamline financial market analysis. Thanks to its native streaming capabilities, such as Delta Live Tables (DLT), it simplifies the process of ingesting and transforming streaming data. This makes handling and analyzing real-time data much more efficient.
For historical data, Databricks supports batch processing, enabling analysts to merge immediate insights with long-term patterns. By unifying these datasets within the Lakehouse platform, Databricks offers a centralized and scalable solution for deep financial analysis.
What are the main advantages of using Delta Live Tables in financial data pipelines?
Delta Live Tables (DLT) make it easier to build and manage financial data pipelines by automating key tasks like ingesting data, transforming it, and keeping an eye on its performance. They include built-in validation checks to maintain reliable data quality and handle both batch and streaming data, which is perfect for gaining real-time insights into financial markets.
By using DLT, you can cut down on operational headaches, simplify workflows, and concentrate on uncovering insights that matter - an ideal solution for handling fast-moving, time-critical financial data.
How does Databricks enhance predictive modeling for financial markets?
Databricks empowers financial market predictions by offering a platform capable of processing massive amounts of high-frequency time series data. Its support for both real-time and batch processing allows predictive models to stay responsive to shifting market dynamics, providing insights that are both timely and precise.
By incorporating tools for machine learning and AI workflows, Databricks makes it easier to create, train, and deploy predictive models. Features like Delta Lake and MLflow simplify tasks like model management and versioning, while its built-in streaming capabilities seamlessly integrate live market data into forecasting workflows. These tools enable financial institutions to develop models that are scalable and dependable, meeting the demands of the fast-paced financial sector.