
Databricks Logging: Setup and Tips
Effective logging in Databricks is essential for monitoring, debugging, and improving workflows in distributed systems. Here's what you need to know:
- Why It Matters: Logging helps track events, errors, and system behavior, making troubleshooting faster and reducing downtime.
- Key Types of Logs:
- Execution logs: For code actions and errors.
- Operational logs: For system performance and resource monitoring.
- Business logs: For metrics like data quality and processing stats.
- Challenges: Logs are spread across nodes and clusters, complicating issue tracing.
- Solutions:
- Use Python's
loggingmodule or Log4j for setup. - Centralize logs with Unity Catalog Volumes or cloud storage (e.g., S3, ADLS).
- Use JSON for structured, machine-readable logs.
- Integrate external tools like Datadog or Splunk for monitoring and alerts.
- Use Python's
Quick Tips:
- Remove default handlers in Databricks to ensure custom logging works.
- Set appropriate log levels (e.g.,
INFO,ERROR) to avoid clutter. - Implement retention policies to manage storage costs (e.g., keep DEBUG logs for 7 days).
- Store logs in persistent, governed locations like Unity Catalog Volumes.
Setting Up Logging in Databricks
Prerequisites for Logging Setup
Before diving in, make sure you have access to a Databricks Workspace, a properly configured compute cluster, and a persistent storage solution. The good news? Python's built-in logging module is ready to use without additional installations.
For storing logs, consider Unity Catalog Volumes or external cloud storage like Amazon S3 or Azure Data Lake Storage (ADLS). These options provide better governance and retention. If you're using Unity Catalog, ensure you have the necessary permissions, such as READ VOLUME and WRITE VOLUME. Keep in mind that log delivery to Volumes is currently in Public Preview and works only with Unity Catalog-enabled compute clusters set to "Standard" or "Dedicated" access modes.
If you're planning to integrate Databricks with external tools like Azure Log Analytics, you'll need additional tools like the Databricks CLI, a Personal Access Token (PAT), JDK 1.8, and Maven 3.6.3.
To ensure smooth logging, enforce log delivery settings using Cluster Policies. Also, initialize your logger right at the beginning of your notebook to capture the entire execution flow.
Configuring Python Logging
Once the prerequisites are sorted, it's time to configure your Python logger. Databricks pre-configures logging before your code runs, which can interfere with custom setups. To address this, you'll need to remove pre-existing handlers. As data engineer Alon Nisser explains:
"Python would IGNORE our custom setup... An existing logger is defined somewhere (in this case, somewhere in the Spark of Databricks stack) before our code is imported, and then everything we configure is ignored".
This is a crucial step to ensure your logs are captured across distributed nodes. Here's a sample configuration to override the default handlers:
import logging
import sys

# Remove existing handlers
for handler in logging.root.handlers[:]:
    logging.root.removeHandler(handler)

# Configure new handler
logging.basicConfig(
    level=logging.INFO,
    format='%(asctime)s - %(name)s - %(levelname)s - %(message)s',
    handlers=[logging.StreamHandler(sys.stdout)]
)

# Silence noisy libraries
logging.getLogger('py4j').setLevel(logging.WARNING)
logging.getLogger('httpx').setLevel(logging.ERROR)

# Test your logger
logger = logging.getLogger(__name__)
logger.info("Logging is configured and ready")
Setting the log level for 'py4j' to WARNING and 'httpx' to ERROR helps reduce unnecessary noise in your logs.
If you want to store logs persistently in Unity Catalog Volumes, you can add a FileHandler to your configuration:
file_handler = logging.FileHandler('/Volumes/catalog/schema/volume/app.log')
file_handler.setLevel(logging.INFO)
file_handler.setFormatter(logging.Formatter('%(asctime)s - %(levelname)s - %(message)s'))
logging.root.addHandler(file_handler)
This setup ensures your logs are not only displayed in real-time but also saved for long-term access.
sbb-itb-61a6e59
Introduction to logging in Databricks
Advanced Logging Techniques
Databricks Log Storage Options Comparison: DBFS vs Unity Catalog vs Cloud Storage
Structured Logging with JSON
Switching to JSON for logs transforms them into a machine-readable format, making it much easier to analyze and process. With JSON logs, you no longer need to rely on complex regular expressions to parse log files. Instead, tools like log aggregators and monitoring systems can directly interpret structured fields.
By adding metadata such as job_id, notebook_id, worker_id, timestamp, and status, you can quickly correlate events across various Spark workers. Imagine a scenario where a job fails on worker node 17 out of 20. With structured logging, you can easily filter logs for that specific node without wading through endless lines of unstructured data. As one data engineer explains:
"Structured logging, where every log entry is a proper JSON object with consistent fields, probably feels like unnecessary work when you're starting out. But when you're debugging a distributed job that's failing on worker node 17 of 20... That's when you'll understand why I'm so opinionated about this." - Toxigon
For Spark internal logs, you can use a cluster initialization script to modify the log4j2.xml configuration and replace the default PatternLayout with JsonTemplateLayout (available for DBR 11.0 and later). For Python application logs, ensure your custom JSON formatting is applied by removing existing handlers at the start of your code. Once converted to JSON, logs can be stored in Unity Catalog Volumes, enabling SQL-based analysis of trends across thousands of jobs.
The next step is to centralize these structured logs for seamless analysis across your Databricks environment.
Centralizing Logs in Databricks
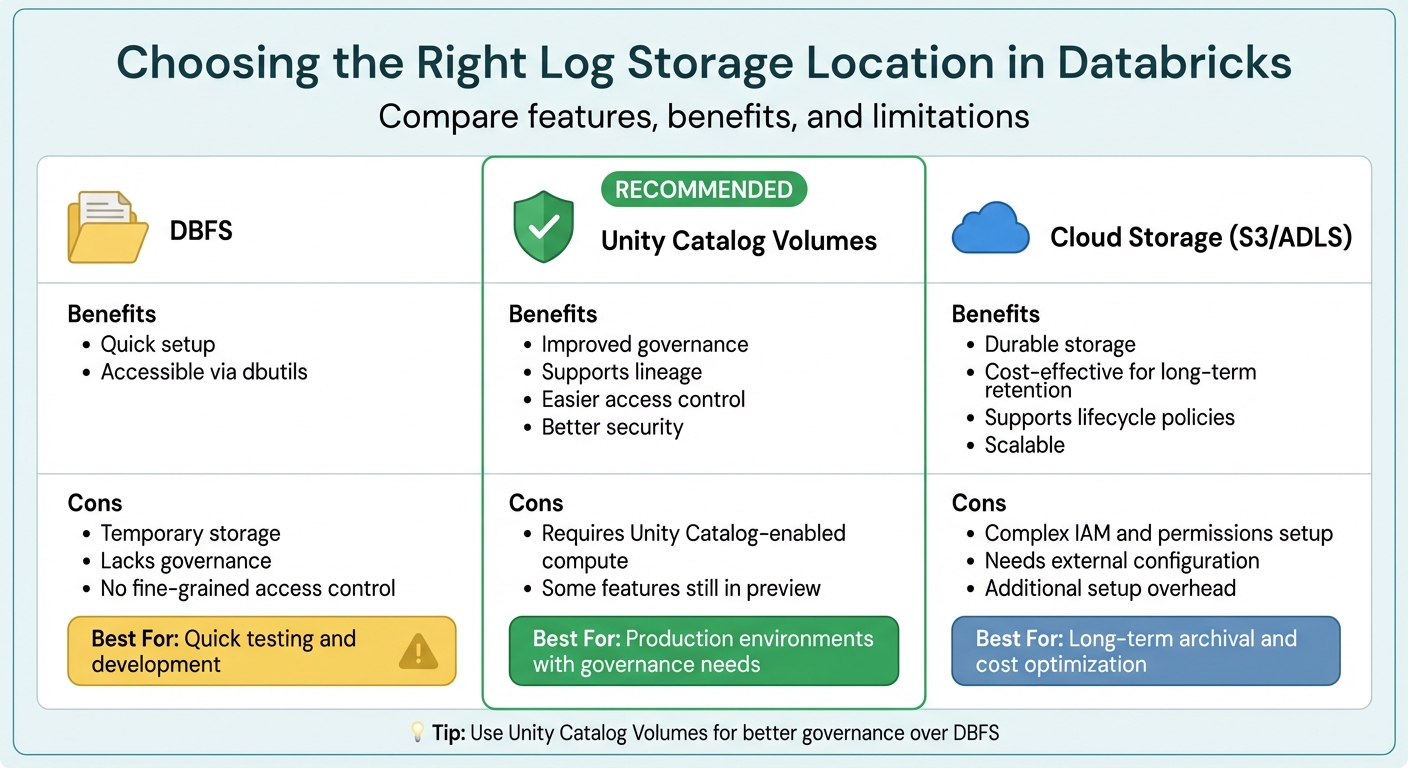
Centralized logging simplifies troubleshooting and makes data management more efficient. Databricks offers several storage options for logs:
| Location | Benefits | Cons |
|---|---|---|
| DBFS | Quick setup; accessible via dbutils |
Temporary storage; lacks governance and fine-grained access control |
| Unity Catalog Volumes | Improved governance; supports lineage; easier access control | Requires Unity Catalog-enabled compute; some features still in preview |
| Cloud Storage (S3/ADLS) | Durable; cost-effective for long-term storage; supports lifecycle policies | Complex IAM and permissions setup; needs external configuration |
To ensure better governance and access control, Unity Catalog Volumes are generally recommended over DBFS. You can enforce centralized logging by using Cluster Policies to set fixed log delivery paths. This way, all clusters automatically route driver, executor, and event logs to a designated Volume.
Once raw logs are centralized, tools like Auto Loader or Lakehouse Declarative Pipelines can help you incrementally load them into Unity Catalog tables using a Bronze/Silver medallion architecture. To manage storage costs, you can also implement lifecycle policies in your cloud storage. For example, INFO-level logs might be retained for 30 days, while DEBUG-level logs are kept for only 7 days.
With centralized logs in place, you can integrate external tools for enhanced monitoring and alerting.
Integrating External Logging Tools
Centralized logs provide a strong foundation for integrating external monitoring and alerting tools. Solutions like Datadog, New Relic, Splunk, and the ELK Stack can offer real-time insights and help correlate logs with other systems. Integration usually involves adding a log-forwarding agent (such as Filebeat for ELK or the Datadog Agent) via cluster initialization scripts, configuring the agent, and starting it across all cluster nodes.
For Azure Log Analytics, you can create a custom Python logger that sends logs through an API using environment variables for Workspace IDs and secret keys. Similarly, the OpenTelemetry (OTel) standard can export traces, logs, and metrics to external collectors or Unity Catalog tables using the OTLP protocol.
To ensure external tools can parse your logs effectively, format them in JSON or NDJSON. If you're using Filebeat, configure it to replace the default @timestamp with the actual event timestamp from your log file. This prevents issues with out-of-order records. For sensitive data like API keys, store them securely in Databricks Secrets and reference them as environment variables in your cluster setup.
As noted by the Databricks team:
"Customers may also wish to integrate their logs with popular logging tools such as Loki, Logstash, or AWS CloudWatch... these would all follow a very similar pattern using the cluster init script to configure and oftentimes run a log-forwarding agent." - Databricks Blog
Best Practices for Databricks Logging
Choosing the Right Logging Levels
Selecting appropriate logging levels is key to avoiding unnecessary data clutter while still capturing essential details. During development, use DEBUG to track variable states and loop iterations. Once in production, switch to INFO as the default to log operational events, like when files start processing or tasks finish. Use WARNING for recoverable issues, such as retries or empty input files, and reserve ERROR for problems that disrupt specific operations but don't crash the application. Save CRITICAL for severe issues, like out-of-memory errors, that force the application to stop running.
"If the job completes successfully, seeing 50 ERROR messages makes me think something's wrong when it's not".
Mismanaged logs can quickly rack up storage costs. To manage this, adopt a tiered retention strategy: keep INFO, WARNING, and ERROR logs for 30 days, but delete DEBUG logs after 7 days. Additionally, reduce unnecessary verbosity from Spark and third-party libraries (like py4j, httpx, or mlflow) by setting higher logging levels for these packages.
By clearly defining logging levels, you can ensure errors are captured effectively, making troubleshooting faster and easier.
Error Handling and Exception Logging
Handling errors efficiently in Databricks involves logging key details like the error condition (unique identifier), SQLSTATE (a five-character standardized code), and message parameters (e.g., file paths or table names). In Python, use logger.error('message', exc_info=True) inside try-except blocks to log full stack traces when failures occur.
For security, log authentication results, data access events (e.g., catalog, schema, and table names), and unusual activities like invalid tokens or denied permissions. Always sanitize logs to remove sensitive information such as passwords or API keys. In production, structure logs in JSON format for easy querying through Databricks AI/BI dashboards or external tools.
With these practices in place, ensure your logging setup is rigorously maintained and regularly tested for consistency and accuracy.
Maintaining and Testing Your Logging Setup
To maintain consistency, enforce logging standards using Cluster Policies. These policies can define fixed log destinations and ensure logs are in JSON format. Store logs in durable locations, such as Unity Catalog Volumes or cloud storage solutions like S3 or ADLS, rather than in DBFS, which is temporary and tied to the cluster's lifecycle.
Streamline log ingestion with Auto Loader and Lakeflow Declarative Pipelines for incremental loading into managed tables. Use cloudFiles.cleanSource to automatically delete raw logs after processing. Incorporate Data Quality Expectations to identify anomalies, like unexpected service names or schema changes, and build dashboards to monitor metrics such as "Top N Errors" or "Top N Jobs by Errors."
Monitor logging costs by querying system tables (e.g., system.billing.usage) to identify expensive jobs. Configure Databricks SQL Alerts to notify administrators within 24 hours of critical events, such as unauthorized access or workspace configuration changes.
"Without building mature logging standards into your data pipelines, troubleshooting errors or job failures takes significantly longer, leading to costly outages, ineffective tiers of escalation, and alert fatigue".
Conclusion
Effective logging in Databricks can redefine how you monitor, debug, and optimize cloud workflows. By adopting structured JSON logging, you make logs both machine-readable and easy to query. Storing these logs in Unity Catalog Volumes ensures they remain persistent and governed, providing a solid foundation for analysis.
The key to success lies in establishing standards early. Use Cluster Policies to enforce consistent log destinations across teams, select appropriate log levels to minimize unnecessary noise, and automate ingestion with Auto Loader to transform raw logs into analytic tables. This streamlined process not only enhances observability but also enables the creation of actionable AI/BI dashboards. Managing log retention is equally critical - it helps control costs and prevents storage issues caused by unmanaged DEBUG logs.
"Logging is arguably the simplest and most impactful of these observability components." – Databricks Blog
Centralized logging unlocks a range of benefits, from AI/BI dashboards and SQL Alerts to improved performance tracking. With enhanced visibility, troubleshooting becomes faster, and costly outages are less likely.
Next Steps for Implementing Databricks Logging
To get started, configure Python logging in your notebooks with JSON formatting. Set up a Unity Catalog Volume as your centralized log destination and use an init script to enforce consistent standards across all clusters. Once your logs are flowing, create an Auto Loader pipeline to ingest them into a managed table for SQL-based analysis.
As your logging practices evolve, consider incorporating advanced features like streaming metrics with StreamingQueryListener, tiered retention policies (e.g., storing INFO/ERROR logs for 30 days and deleting DEBUG logs after 7 days), and enabling Verbose Audit Logs for detailed command tracking. For more advanced needs, you can integrate with external tools like Datadog or Splunk for cross-platform monitoring.
For those looking to deepen their expertise, DataExpert.io Academy offers hands-on boot camps in data engineering and analytics. These programs include practical experience with tools like Databricks, AWS, and Snowflake, along with capstone projects and career resources to help you apply these logging practices in real-world scenarios.
FAQs
How can I make sure my custom Python logger works in Databricks?
To make sure your custom Python logger functions correctly in Databricks, you need to configure it to send logs either to stdout or a centralized storage system. Start by enabling log propagation with logger.propagate = True and ensure the log level - such as INFO or DEBUG - matches your needs. Test the logger both locally and within Databricks to verify that logs show up in the driver or cluster logs. For distributed jobs, centralized logging is a good option to keep everything organized.
What’s the best place to store Databricks logs long term?
The most effective solution for long-term storage of Databricks logs is using an Amazon S3 bucket. By setting up an S3 bucket and creating a storage configuration record in Databricks, you can route logs directly to this storage. This approach provides reliable and scalable storage for audit logs and other data, making it easier to manage retention, perform analysis, and meet compliance requirements.
How can I centralize driver and executor logs across clusters?
To centralize driver and executor logs in Databricks, you can set up a shared log storage location, like DBFS (Databricks File System), and activate Spark’s built-in logging capabilities. You can achieve this by using init scripts or adjusting Spark settings to collect logs from both driver and executor nodes. This approach consolidates logs from all clusters into a single location, making it easier to monitor, troubleshoot, and analyze activity across your environment.