Kubernetes Best Practices for Data Teams
Kubernetes simplifies deploying and managing data workflows like ETL, streaming, and machine learning. It automates scaling, resource allocation, and failure recovery, making it ideal for handling complex pipelines. Companies like Uber and Salesforce use Kubernetes to process massive workloads efficiently, saving costs and avoiding vendor lock-in.
Key Takeaways:
- Cluster Setup: Use namespaces to organize resources and ResourceQuotas to control CPU and memory usage.
- Data Tools Integration: Seamlessly run tools like Apache Spark and Airflow with Kubernetes-native features.
- Resource Management: Set resource requests and limits to prevent overuse and enable smooth scaling.
- Scaling: Use Horizontal Pod Autoscaling (HPA) for dynamic workloads and spot instances for cost savings.
- Security: Implement RBAC, network policies, and container image scanning to protect data environments.
- Monitoring: Leverage Prometheus and Grafana for metrics, logs, and traces to ensure pipeline reliability.
- GitOps: Manage configurations in Git for version control, audit trails, and automated rollbacks.
- Cost Optimization: Use tools like Kubecost and tagging to track and reduce expenses.
This guide covers everything from setup to scaling and security, helping data teams streamline operations and cut costs with Kubernetes.
Setting Up Kubernetes for Data Engineering
Cluster Setup and Namespace Structure
When setting up Kubernetes for data engineering, start by deploying a cluster that aligns with the nature of your data workloads. These workloads generally fall into two categories: dynamic clusters for high-churn batch jobs and static clusters for persistent tasks like streaming or model training. For large-scale operations, clusters may handle over 500 nodes and 5,000 pods, or even create and destroy hundreds of resources every minute.
Namespaces are your go-to tool for organizing and isolating resources within the cluster. You can divide namespaces by environment - such as development, staging, or production. Alternatively, create namespaces for specific teams or projects, like data-science or etl-pipelines, to avoid naming conflicts and resource contention.
"Kubernetes namespaces help different projects, teams, or customers to share a Kubernetes cluster." - Kubernetes Documentation
To further control resource usage, implement ResourceQuotas within namespaces. These quotas let you set limits on CPU and memory usage, ensuring that no single job monopolizes resources. For instance, you can allocate more resources to production environments while capping usage in development. Plus, every service within a namespace gets a DNS entry like my-service.my-namespace.svc.cluster.local, simplifying internal service discovery.
Once your cluster and namespaces are structured effectively, it’s time to integrate the data tools essential for your workflows.
Connecting Kubernetes with Data Tools
Kubernetes can seamlessly integrate with various data tools through custom configurations. For Apache Spark, use spark-submit with the k8s:// master URL to deploy drivers and executors as native pods. When running Spark in client mode, a headless service can provide a stable hostname for driver-executor communication. It's best to use Kubernetes version 1.32 or later to leverage the latest features in Spark 4.1.0.
For Apache Airflow, deploy it using the official Helm chart for a consistent setup. The KubernetesExecutor is particularly useful, as it runs tasks in separate pods, offering precise control over resource allocation. You can further customize pods using the pod_mutation_hook in Airflow settings, which allows you to add sidecars or init containers globally for every worker pod.
Efficient storage is crucial for data-heavy operations. Use Persistent Volume Claims (PVCs) for datasets that need to persist across runs. For Spark shuffle data, consider mounting tmpfs (RAM-backed volumes) by enabling spark.kubernetes.local.dirs.tmpfs=true - this helps mitigate performance issues on nodes with slower remote storage. For dbt transformations, leverage Kubernetes Jobs or the KubernetesPodOperator in Airflow for scalable, temporary execution.
Lastly, maintain all Kubernetes manifests in Git repositories. This practice enables easy rollbacks and ensures a complete audit trail, rather than applying configurations directly from your local machine.
Resource Allocation and Scaling
Setting Resource Requests and Limits
When managing Kubernetes resources, requests and limits play a key role. Requests ensure a container gets the minimum resources it needs to operate, while limits define the maximum it can consume. These settings guide the kube-scheduler in placing pods on nodes with sufficient capacity. For reference, in Kubernetes, 1 CPU unit equals one physical or virtual CPU core.
Resource behavior differs between CPU and memory when a container exceeds its limits. CPU overuse triggers throttling - the kernel slows down the container's CPU access without stopping it. On the other hand, memory overuse can lead to termination. If a container surpasses its memory limit, the Out-of-Memory (OOM) killer may shut it down, especially under memory pressure.
For workloads like Spark jobs, it's wise to set memory limits slightly above anticipated peaks. This buffer helps avoid OOM kills during unexpected data surges. Additionally, ResourceQuotas can be applied at the namespace level to control total resource usage for a team. With Kubernetes v1.34 (beta), you can even define a shared resource budget at the pod level, allowing containers within the same pod to share idle resources.
This level of precision in resource allocation lays the groundwork for effective scaling strategies.
Horizontal Pod Autoscaling for Data Pipelines
HorizontalPodAutoscaler (HPA) is a control loop that dynamically adjusts the number of pod replicas based on resource utilization. It checks metrics every 15 seconds and calculates usage as a percentage of the requests specified in the pod configuration. Without defined requests, HPA can't act on those metrics.
"If some of the Pod's containers do not have the relevant resource request set, CPU utilization for the Pod will not be defined and the autoscaler will not take any action for that metric."
- Kubernetes Documentation
To avoid constant scaling up and down, HPA includes a default 10% tolerance and a 5-minute stabilization window. For applications with high startup overhead, such as Java-based Spark executors, the --horizontal-pod-autoscaler-cpu-initialization-period (default is 5 minutes) ignores initial CPU spikes when making scaling decisions. Pair this with readinessProbes or startupProbes configured with an adequate initialDelaySeconds to prevent premature scale-ups during initialization.
When using HPA, it's crucial to remove the spec.replicas field from Deployment or StatefulSet manifests. This prevents conflicts during kubectl apply operations, which could reset the replica count to a static value.
For event-driven pipelines using queues like Kafka or RabbitMQ, KEDA (Kubernetes Event Driven Autoscaling) is a great addition. KEDA can scale pods down to zero when no data is present and scale up based on event lag. Combined with HPA, this approach fine-tunes scaling for such pipelines.
Node Autoscaling with Spot Instances
Node autoscalers like Cluster Autoscaler and Karpenter adjust the number of nodes in a cluster based on workload demands. They add nodes for unschedulable pods and consolidate underused nodes to cut costs. Spot instances are particularly effective for fault-tolerant workloads like ETL jobs, as these tasks can restart if a node is reclaimed by the cloud provider.
Karpenter provides more flexibility compared to Cluster Autoscaler. Unlike Cluster Autoscaler, which relies on pre-configured node groups, Karpenter dynamically provisions nodes based on pending pod requirements. It also manages the entire node lifecycle, including upgrades and age-based rotations.
To optimize resource usage, deploy low-priority placeholder pods that reserve capacity. These pods can be evicted when demand spikes, freeing up resources immediately. Accurate resource requests are critical here - overestimating requests prevents node consolidation, while underestimating them could lead to scheduling issues.
Nodes hosting only DaemonSet or static pods are easier to consolidate. Pairing node autoscaling with HPA ensures that as application demand grows and more pods are created, the cluster automatically provisions the necessary underlying infrastructure.
Kubernetes for Modern Data Engineering: An End to End Data Engineering Project
Security for Kubernetes Data Environments
Securing a Kubernetes environment is a must for safeguarding the integrity and performance of your data workloads. Between 2018 and 2023, Kubernetes vulnerabilities spiked by 440%, and 37% of organizations reported revenue or customer losses due to security breaches. To protect sensitive data pipelines, a multi-layered security strategy is crucial - emphasizing access control, network isolation, and container security.
Role-Based Access Control (RBAC) for Data Teams
RBAC plays a key role in defining who can access specific Kubernetes resources and what actions they can perform. Following the principle of least privilege, grant only the permissions that are absolutely necessary for each user or service account. Use Role and RoleBinding to limit permissions to specific namespaces, avoiding the broader ClusterRoleBinding unless absolutely required.
Avoid using wildcards in RBAC rules. Instead of *, explicitly list API groups, resources, and actions. For instance, use verbs: ["get", "list"] instead of verbs: ["*"] to prevent inadvertently granting permissions like delete or patch.
Assign a unique Kubernetes service account to each data pipeline or workload, and avoid relying on the default service account, which is automatically assigned to pods without a specified account. For workloads that don’t need to interact with the Kubernetes API, set automountServiceAccountToken: false in the pod specification.
When managing Secret permissions, restrict list and watch verbs since they can expose the full contents of all secrets in a namespace. As highlighted in Kubernetes documentation:
"Granting list access to Secrets implicitly lets the subject fetch the contents of the Secrets".
Additionally, limit which users can create pods or deployments, as these actions inherently provide access to all Secrets, ConfigMaps, and PersistentVolumes within a namespace. Conduct periodic reviews of RBAC settings, ideally every two years or less, to ensure permissions remain appropriate.
Once user-level permissions are secured through RBAC, the next step is to implement strict network boundaries.
Network Policies for Access Control
Network policies act as a firewall for Kubernetes, managing traffic at the IP and port level for TCP, UDP, and SCTP protocols. By default, pods accept all traffic, so it’s essential to start with a deny-all policy for both ingress and egress in sensitive namespaces. From there, explicitly allow only the necessary traffic.
For data teams working with external platforms like Snowflake or Databricks, configure egress rules using ipBlock to restrict outbound traffic to specific CIDR ranges and ports (e.g., TCP 443). Additionally, block pods from accessing cloud metadata APIs (e.g., 169.254.169.254 on AWS or GCP) to prevent attackers from obtaining node credentials.
Network policies are additive, meaning the allowed traffic is the combined result of all applicable rules. Use selectors like podSelector for targeting specific pods, namespaceSelector for labeled namespaces, and ipBlock for external traffic control. Since namespaces can’t be directly targeted by name, apply consistent labels (e.g., tenant: data-science) and use namespaceSelector for cross-namespace traffic management. For workloads requiring multiple ports, take advantage of the endPort field (available since v1.25) to define a range of ports in a single rule.
Container Image Security and Scanning
Securing container images is another cornerstone of Kubernetes security. Reduce the attack surface by performing vulnerability scans at three stages: pre-deployment, during CI/CD, and post-deployment. According to the 2024 Verizon Data Breach Investigation Report, 15% of breaches stemmed from third-party vulnerabilities in the software supply chain.
Opt for minimal base images like distroless or Alpine, which exclude unnecessary tools like shells and package managers. For statically compiled languages like Go, consider using an empty or scratch image to further minimize vulnerabilities by including only the application code. As Kubernetes documentation advises:
"Images used in production should not contain shells or debugging utilities, as an ephemeral debug container can be used for troubleshooting".
Avoid mutable tags like :latest, which can introduce uncertainty about the deployed version. Instead, reference images using their unique sha256 digests to guarantee that the scanned and approved version is what gets deployed. Additionally, ensure containers run as non-root users by including the USER instruction in the Dockerfile, reducing the risk of privilege escalation.
Integrate tools such as Trivy or Grype into your CI/CD pipelines to automatically flag builds with vulnerabilities exceeding a set CVSS threshold. Use admission controllers like Kyverno to block pods that attempt to run unapproved or unscanned images. Secrets should never be baked into images; instead, manage them through Kubernetes Secrets or external tools like HashiCorp Vault, mounting them as read-only volumes.
Post-deployment scanning is equally important, as new vulnerabilities (CVEs) are discovered daily. As SentinelOne warns:
"A single vulnerable container can compromise the entire cluster, propagating weaknesses across interconnected services".
sbb-itb-61a6e59
Monitoring and Observability
Keeping a close eye on cluster health and pipeline performance is essential. To do this effectively, you need to gather three types of data: metrics (which reveal performance and health), logs (a chronological record of events), and traces (which show the flow of requests across components). For teams managing batch jobs and streaming pipelines, this observability stack plays a crucial role in catching failures early and ensuring data stays up-to-date.
When it comes to Kubernetes monitoring, Prometheus and Grafana are the go-to tools. Prometheus collects metrics from endpoints like /metrics, while Grafana turns those metrics into visual dashboards. The data is primarily sourced from the kubelet (via cAdvisor for container stats), kube-state-metrics (for object states), and Node Exporter (for hardware-level metrics), making it easier to track and improve performance. With this setup, teams can zero in on the metrics that directly impact pipeline reliability.
Key Metrics for Data Workloads
For data pipelines, it's smart to monitor metrics that reveal job stability and resource efficiency. For example, track pod restarts using the PromQL query increase(kube_pod_container_status_restarts_total[1h]) to quickly identify unstable containers. Similarly, watch for gaps between kube_pod_resource_request and kube_pod_resource_limit to catch workloads that can't run due to resource constraints.
Batch jobs require special attention to completion rates. Use job_controller_job_pods_finished_total to measure success and failure rates, and monitor cronjob_controller_job_creation_skew_duration_seconds to ensure scheduled jobs run on time. For stateful workloads, keep an eye on Persistent Volume (PV) status and set disk alerts to trigger at 75% capacity. This helps avoid node pressure that could disrupt data pipelines. If you're running AI/ML workloads, consider integrating NVIDIA Data Center GPU Manager (DCGM) metrics to track GPU health and usage.
Disk or network bottlenecks can also throttle your pipelines. Use Pressure Stall Information (PSI) metrics like container_pressure_io_stalled_seconds_total to identify these issues. As Anjali Udasi from Last9 explains:
"The goal isn't to have more alerts - it's to have the right ones. Focus on signals that call for real attention rather than those that just add background noise".
Dashboards and Alerts
To stay on top of things, build dashboards around the Four Golden Signals: Latency (response time), Traffic (demand), Errors (failure rates), and Saturation (resource capacity). A quick way to deploy Prometheus, Grafana, and Alertmanager together is by using the kube-prometheus-stack Helm chart. For teams practicing GitOps, the Prometheus Operator's ServiceMonitor can automatically discover and scrape metrics from new data services.
Set up alerts with clear severity levels to avoid overwhelming your team. SEV1 alerts should cover critical issues like the kube-apiserver being down or etcd becoming unhealthy. SEV2 alerts can handle major degradations, such as HPA failures or PVCs stuck in Pending. Each alert should have an assigned owner and a documented runbook. As Trilio puts it:
"If there is no action to take, then there is no reason for it to be an alert".
To manage storage costs, set retention policies carefully. For instance, 100,000 active time series in Prometheus will need about 2–4 GB of RAM. For long-term storage, tools like Thanos or Cortex can archive historical data in object storage. Additionally, consider using Grafana Loki for log aggregation. Unlike traditional log systems, Loki indexes metadata instead of full log content, making it a cost-effective solution for handling large volumes of logs. Together with earlier security and scaling measures, these dashboards and monitoring practices help keep your data pipelines running smoothly and efficiently.
GitOps and Configuration Management
Managing configurations manually with kubectl often leads to chaos - unexpected changes, hard-to-track rollbacks, and a lack of transparency. GitOps flips this script by treating Git as the single source of truth for all your Kubernetes configurations. As Google Cloud Documentation puts it:
"GitOps is an approach to managing infrastructure and application configuration by using a version control system like Git as the single source of truth."
Rather than issuing imperative commands, you define the desired state of your data pipelines in declarative YAML manifests. Tools like ArgoCD and Flux monitor your cluster continuously, ensuring that the live state matches the configuration in Git. If someone makes a manual change - like tweaking a production Spark job - the GitOps agent identifies the drift and automatically reverts it, keeping your workloads stable and eliminating configuration inconsistencies.
But GitOps isn’t just about automation. Every configuration update is a Git commit, creating an audit trail that shows who made what changes and when. For data teams handling sensitive production environments, this visibility is invaluable. And if something goes wrong? Rolling back to a previous state is as simple as running a git revert, with the GitOps controller taking care of the rest.
Managing Configurations as Code
When a pipeline fails, GitOps makes troubleshooting straightforward. You can compare the current configuration against previous commits to spot unexpected changes and revert to a stable version. This approach is particularly useful for managing complex workloads, such as Airflow DAGs, Spark executors, or metadata catalogs, all defined and version-controlled in YAML.
To avoid issues like infinite CI build loops, keep Kubernetes manifests in a separate repository from your application source code. This separation also allows for distinct access permissions - developers can update application code, while only operators manage production configurations.
For predictable deployments, pin dependencies to specific Git tags or commit SHAs in tools like Helm and Kustomize. For example, instead of running helm install my-chart stable/spark, specify the version explicitly: helm install my-chart stable/spark --version 3.2.1. This ensures consistency, even if upstream dependencies change.
It’s also better to use "WET" (Write Everything Twice) configurations rather than relying on DRY templates. While it may seem repetitive, WET configurations clearly show the intended state without requiring additional processing. As Kubernetes Contributor Kirti Goyal points out:
"Configuration is at the heart of every Kubernetes workload. A missing quote, a wrong API version or a misplaced YAML indent can ruin your entire deploy."
For managing different environments like development and production, organize configurations into separate folders (e.g., /dev and /prod) within the same repository. This structure simplifies comparisons and allows you to deploy changes across multiple clusters in a single pull request. Additionally, avoid tracking fields in Git that are dynamically managed by controllers. For instance, if you use a Horizontal Pod Autoscaler for Spark jobs, leave out the replicas field to prevent conflicts between Git and the live cluster state.
This declarative approach not only simplifies management but also integrates seamlessly with tools that enforce deployment policies.
Policy Enforcement for Deployments
GitOps doesn’t just manage configurations - it enforces compliance. Tools like Open Policy Agent (OPA) and Kyverno work alongside GitOps workflows to block non-compliant manifests automatically. For example, you can prevent configurations that run containers as root, enforce resource limits on Spark executors, or require specific security labels for pods handling sensitive data.
Policy enforcement happens at the Git level. When a developer submits a pull request with a new configuration, policy engines scan the YAML for violations before it’s merged. This proactive approach - often called "shift left" - catches issues like missing resource requests, privileged containers, or outdated API versions before they impact production. For instance, you might enforce a rule requiring all batch jobs to include a backoffLimit to avoid infinite retry loops that drain resources.
Kyverno stands out for its Kubernetes-native approach, using YAML syntax instead of a separate policy language. You can write rules to ensure, for example, that all pods in the data-engineering namespace have CPU limits or that container images come from approved registries. If ArgoCD or Flux tries to sync a manifest that breaks these rules, the deployment is blocked, and your team gets immediate feedback on what needs fixing.
For teams managing multiple environments, consistent policy enforcement reduces the need for manual reviews. Combined with Git’s audit trail, this automated process ensures compliance teams can easily verify that no unauthorized configurations make it to production.
Cost Management and Budget Tracking
Kubernetes Best Practices for Data Teams: Cost Optimization Strategies and Savings
Keeping costs in check is just as important as efficient resource allocation when running Kubernetes clusters. Without proper monitoring, expenses for data pipelines can spiral out of control. Kubernetes, with its abstraction of underlying compute resources, makes it tricky to pinpoint which team, project, or Spark job is racking up costs. This lack of visibility can lead to inefficiencies slipping through the cracks, leaving teams unaccountable for overspending.
The key to tackling this challenge lies in resource tagging and integrating FinOps practices. By tagging pods and namespaces with cost-tracking metadata, you can tie Kubernetes workloads directly to your cloud bill. This visibility not only helps you monitor spending but also supports ongoing optimization. Let’s dive into how resource tagging sets the stage for better cost attribution.
Tagging Resources for Cost Tracking
Kubernetes labels are the cornerstone of cost attribution. By adding metadata like team=data-eng, project=customer-analytics, or env=prod to your pods and namespaces, you can trace costs back to specific teams or business units. Cloud providers recognize these labels as cost allocation tags in their billing systems - AWS includes them in Cost and Usage Reports stored in S3, while GCP exports them to BigQuery.
AWS allows up to 50 Kubernetes labels per pod for cost allocation. However, if you exceed this limit, only the first 50 labels alphabetically are processed. This makes it crucial to name your key cost-tracking labels strategically - for instance, using aaa-team ensures it’s always included, whereas a label like zzz-project might get dropped. Once imported, these tags need to be manually activated in the billing console, and the data typically appears within 24–48 hours. For GKE users, cost allocation data may take up to three days to reflect in Cloud Billing.
For teams running batch jobs, automated tagging can simplify cost tracking. Amazon EMR on EKS, for example, automatically attaches labels like spark-app-name and spark-app-id to pods, enabling granular tracking of Spark job costs. This level of detail helps uncover inefficiencies - like a nightly ETL job requesting 32 GB of memory but using only 8 GB - and supports resizing workloads to match actual needs.
To calculate the total cost of ownership (TCO) for a data pipeline, it’s important to use consistent label keys across Kubernetes pods and external cloud resources. For instance, if an Airflow DAG uses S3 buckets and RDS instances, tagging everything with project=revenue-forecasting ensures you can consolidate costs across compute, storage, and databases into a unified view.
"The ability to visualize application costs running on Amazon EKS using Kubernetes labels enables organizations to gain valuable insights into their spending patterns."
- AWS Cloud Financial Management
FinOps Integration for Budget Control
While tagging provides visibility, FinOps takes it a step further by enabling proactive cost management. According to the 2023 State of Kubernetes Report, defining resource requests is one of the most effective ways to control cluster costs. Without these requests, pods can "squat" on nodes, reserving resources that go unused. In fact, about 30% of CPU and memory allocations in typical environments are wasted, and right-sizing workloads can cut costs by 20%.
Tools like Kubecost can provide real-time cost breakdowns at various levels - pods, namespaces, and labels - while offering optimization suggestions. For instance, Kubecost can identify workloads running on expensive on-demand instances that could be shifted to Spot instances or flag orphaned Persistent Volume Claims (PVCs) that continue to incur costs even though they’re no longer in use. A compelling example comes from StreamForge AI, an AI platform using AWS EKS. In September 2025, they implemented a FinOps strategy to manage their $1.15 million monthly bill. By enforcing cost-center labels with OPA Gatekeeper, moving non-critical Ray tuning jobs to Spot GPUs with 3-minute checkpointing, and using Kubecost to detect underutilized GPU memory, they boosted GPU utilization from 38% and saved thousands by automating the deletion of unattached PVCs older than seven days.
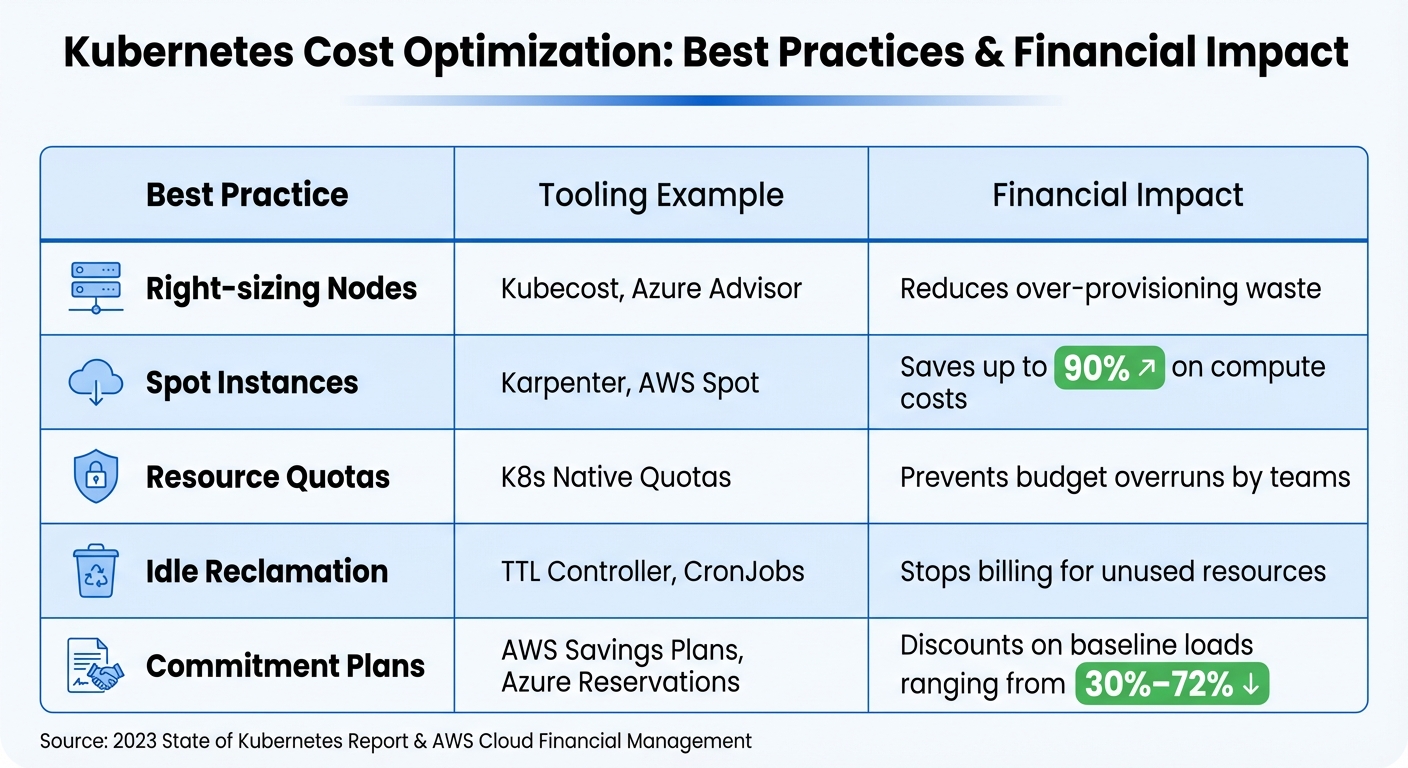
| Best Practice | Tooling Example | Financial Impact |
|---|---|---|
| Right-sizing Nodes | Kubecost, Azure Advisor | Reduces over-provisioning waste |
| Spot Instances | Karpenter, AWS Spot | Saves up to 90% on compute costs |
| Resource Quotas | K8s Native Quotas | Prevents budget overruns by teams |
| Idle Reclamation | TTL Controller, CronJobs | Stops billing for unused resources |
| Commitment Plans | AWS Savings Plans, Azure Reservations | Offers 30%–72% discounts on baseline loads |
To ensure accountability, establish a practice where every namespace is tied to a cost center. Use admission controllers like OPA Gatekeeper to reject pods without proper labels. For production workloads with predictable demand, Reserved Instances or Savings Plans can provide discounts of up to 72% on AWS or 65% on Azure. For fault-tolerant batch jobs - like nightly Spark transformations or model training - Spot instances can offer savings of up to 90% compared to on-demand pricing.
Autoscaling is another powerful tool for managing costs. Horizontal Pod Autoscaling (HPA) adjusts the number of replicas based on CPU or custom metrics, while Cluster Autoscalers or tools like Karpenter scale nodes dynamically. This approach can cut resource usage by as much as 30% during off-peak hours. To maximize efficiency, configure autoscalers to monitor both performance metrics (like latency) and financial metrics (such as cost per request). Storage costs shouldn’t be overlooked either - regularly auditing and deleting orphaned Persistent Volumes and using dynamic CSI tiering to move data from expensive SSDs to cost-effective options like S3 or Glacier can lead to significant savings.
Conclusion
Using Kubernetes for data workloads provides a platform that's scalable, secure, and cost-conscious.
Setting accurate CPU and memory requests helps prevent resource conflicts among containers, while defined limits keep runaway processes in check. By aligning requests with limits, you achieve Guaranteed QoS, which minimizes pod evictions during times of node pressure. As Shyam Mohan from Razorops puts it:
"Optimizing Kubernetes for cost efficiency ensures you're only paying for what you need, not what you don't, while also keeping your applications running smoothly".
Security remains a cornerstone of Kubernetes. Features like robust RBAC, encrypted Secrets, and default-deny network policies protect your cluster. Additionally, using namespaces with resource quotas helps isolate teams and projects, ensuring one team’s workload doesn’t impact another’s resources.
For cost management, tools like Karpenter enable autoscaling, and strategies such as leveraging spot instances and resource tagging keep expenses predictable. Together, these approaches enhance the platform's overall reliability and efficiency.
By adopting these practices, you create a Kubernetes environment that's both stable and efficient. Kirti Goyal sums it up perfectly:
"Cleaner configuration leads to calmer cluster administrators".
For data teams handling everything from nightly ETL jobs to real-time analytics, this streamlined setup means faster deployments, fewer disruptions, and more time to focus on solving critical data challenges.
FAQs
How does Kubernetes help data teams stay flexible and avoid being tied to a single vendor?
Kubernetes offers data teams the freedom to deploy applications across diverse environments - whether that's multiple cloud providers or on-premises systems. This capability ensures teams can avoid being tied to a single vendor's ecosystem, giving them greater flexibility in their operations.
By adopting Kubernetes-native practices, teams can streamline their workflows and infrastructure. This standardization simplifies scaling, adapting, and integrating with various tools and platforms, enabling a more agile and robust approach to data engineering.
What are the best practices for securing Kubernetes data environments?
Securing Kubernetes data environments calls for a thoughtful approach with a few essential practices. One key step is to encrypt Secrets at rest. By default, Secrets are stored unencrypted, which leaves sensitive data exposed. Configuring encryption ensures this data remains protected from unauthorized access.
Another crucial measure is implementing Role-Based Access Control (RBAC). RBAC helps enforce the principle of least privilege, restricting access so only authorized users can view or modify sensitive information.
To bolster security further, make sure all communication within the cluster is safeguarded with TLS encryption. This prevents interception and tampering of data as it moves through the system. On top of that, conducting regular security audits, enforcing Pod Security Standards, and defining network policies can significantly reduce potential vulnerabilities.
By layering these strategies, you can build a strong security framework that keeps your Kubernetes data environments well-protected.
What are the benefits of using GitOps for managing Kubernetes configurations?
GitOps streamlines Kubernetes configuration management by using a Git repository as the central hub for all infrastructure and application configurations. This method ensures that every modification is logged, traceable, and easily reversible, minimizing the chances of mistakes and preventing configuration mismatches.
By automating the synchronization between your Git repository and Kubernetes clusters, GitOps delivers consistent deployments, scalable configurations, and fast recovery from issues. Need to roll back? Just revert a Git commit - it’s that straightforward. With its focus on version control, automation, and declarative setups, GitOps simplifies the challenge of managing Kubernetes at scale.