
7 Signs Python Pipelines Need Performance Profiling
If your Python pipeline is getting slower, retrying more, or missing its deadline, I’d secure your data and profile the code before making changes. In many cases, the problem shows up in a small set of signals: runtime, queue wait, throughput, memory, CPU, retries, and data lag.
Here’s the short version:
- If batch runtime keeps climbing, I’d check for reprocessing, data growth, or slow queries.
- If workers are idle but backlog grows, I’d look at the scheduler, broker, or concurrency limits.
- If memory jumps near the container limit, I’d trace allocations before the next
OOMKilled. - If retries start piling up, I’d trace the failing dependency path, not just the task code.
- If tasks spend too long in
queuedbeforestarted, I’d measure dispatch and cold-start delay. - If input rate stays above processed rate, I’d profile by stage to find the slowdown.
- If CPU is stuck below 20% or above 85%–90%, I’d check whether the pipeline is mismatched to its resources.
A few numbers from the article make the point fast: one pipeline cut runtime from 9.5 hours to 45 minutes, another hit a 15x compute spike from repeat processing, and memory risk became plain when a job climbed from 4 GB to 7.8 GB in an 8 GB container.
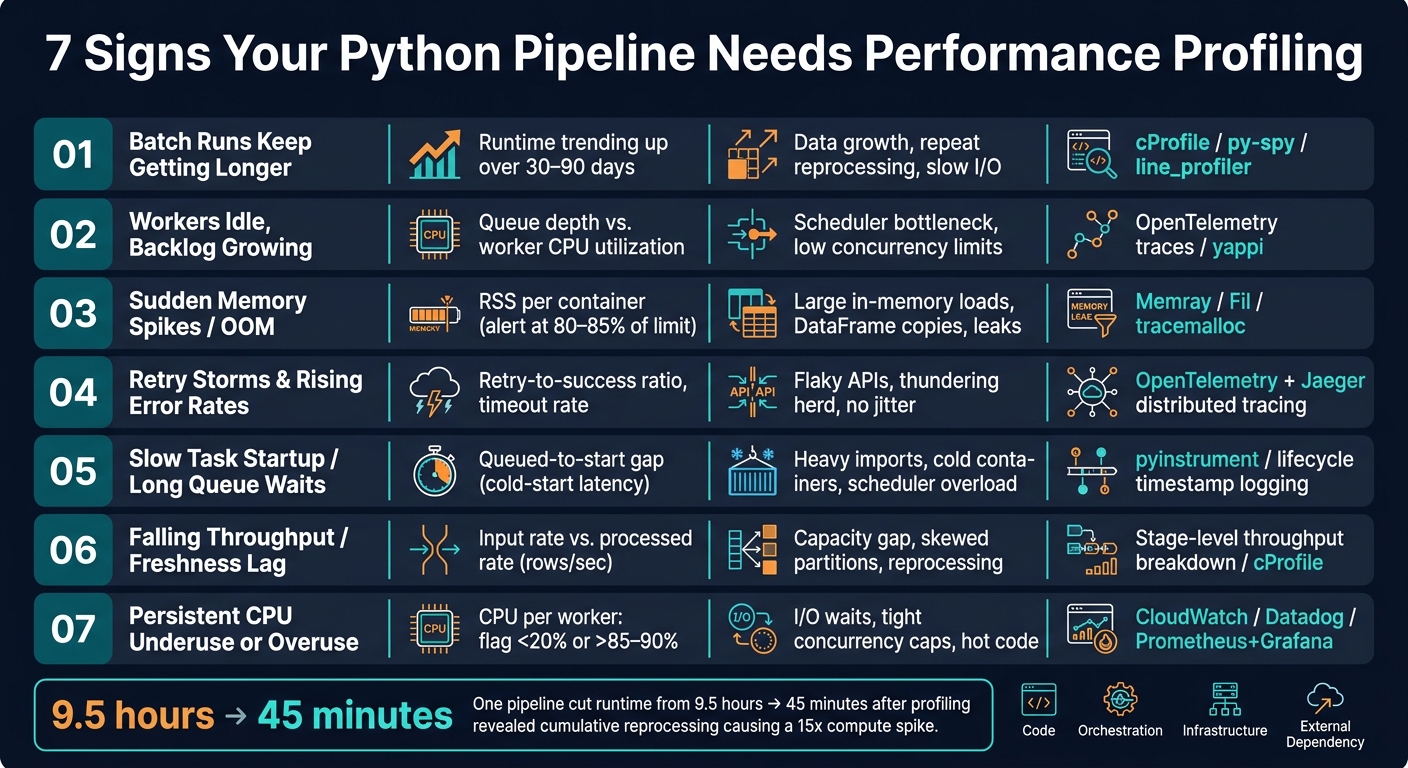
7 Signs Your Python Pipeline Needs Performance Profiling
The Easiest Way To Find Performance Bottlenecks in Python [ft.cProfile]
sbb-itb-61a6e59
Quick Comparison
| Sign | What I’d check first | What it often means |
|---|---|---|
| Batch runs get longer | Task duration and input volume | More data, repeat work, or slow I/O |
| Idle workers, growing backlog | Queue depth and scheduling delay | Orchestration or dispatch slowdown |
| Memory spikes / OOM | RSS and allocation traces | Large in-memory loads or leaks |
| Retry storms | Retry-to-success ratio and traces | Failing API, DB, or timeout setup |
| Slow startup / long waits | Queued-to-start gap | Scheduler delay or cold starts |
| Falling throughput / lag | Input vs. processed rate | Capacity gap or slow stage |
| CPU underuse or overuse | Worker CPU and memory trends | I/O waits, tight limits, or hot code |
Bottom line: I’d use these seven signs as a fast check to see whether the bottleneck is in code, orchestration, infrastructure, or an external system.
What Performance Profiling Reveals in a Pipeline
Profiling answers the question logs and dashboards usually can't: where is the time actually going? A pipeline may look healthy on the surface while still chewing through compute or inching toward an out-of-memory crash. Profiling splits runtime into layers like code execution, queue wait time, orchestration overhead, infra limits, and external calls, so you can see which layer is causing the slowdown.
In one large deduplication pipeline, profiling showed that an hourly merge was reprocessing almost a full day of data on every run. That drove a 15x compute spike. A tree-shaped DAG redesign dropped runtime from 9.5 hours to 45 minutes. That kind of issue is exactly what the seven warning signs below are meant to catch.
The seven signs in this article map to a small set of core signals. Think of them as your diagnostic panel:
| Signal | What It Measures | What It Points To |
|---|---|---|
| Task duration | Task runtime | Inefficient code, growing inputs, or slow external queries |
| Queue wait time | Time a task waits for a worker | Orchestration limits, concurrency caps, or under-provisioned workers |
| Records per second | Stage throughput | Capacity gaps, regressions, or slower external dependencies |
| Memory growth | Memory growth over time | Leaks, oversized data structures, or non-streaming batch loads |
| CPU saturation | CPU utilization | Compute-bound code vs. I/O-bound or orchestration delays |
| Retry rate | Task retry rate | Flaky external systems, transient network issues, or timeout misconfigurations |
| Data freshness lag | Time from data creation to availability | Slow tasks, long queues, or upstream SLA misses |
No single signal gives you the whole picture. Low CPU with slow runtimes usually points to I/O or orchestration delays, not slow Python code. High CPU with slow tasks more often means the work is compute-bound. Look at the signals together, and the seven signs below will make a lot more sense.
1. Batch Runs That Keep Getting Longer Overnight
This problem shows up when a nightly ETL or analytics job starts spilling past its overnight window. The run still finishes, but it finishes too late. Dashboards miss their usual load time, downstream jobs get pushed back, and reports aren't ready when people expect them.
From a profiling angle, you’ll usually see one of two things: task duration is climbing, queue wait time is climbing, or both. Most of the time, the reason is pretty plain. There’s more data to process, more data getting processed again, or workers are fighting for the same resources.
Primary Bottleneck Category
Start by looking at scaling limits or cumulative reprocessing. As input volume grows, runtime tends to grow with it. And in many pipelines, the later stages quietly end up reprocessing almost the entire day’s data instead of just handling the new slice.
Operational Metric to Inspect
Track total run duration across the last 30–90 days and compare it against input volume. That gives you a quick read on whether runtime is drifting in step with data growth.
Then look at per-task runtime to spot the stage that’s slowing things down. After that, check:
- CPU usage
- Memory usage
- Queue wait time
Those signals help you sort out whether the slowdown comes from compute, I/O, or scheduling.
Likely Root Cause
A few patterns show up again and again. Some transformations get more expensive over time, like extra joins, row-wise apply() calls, and repeated merges. Sometimes the pipeline just can’t keep up with data growth. In other cases, database queries slow down as tables get bigger.
There’s also the scheduler side of the problem. A task may not be slow on its own, but if it spends a long time sitting in queue waiting for workers, the total elapsed runtime can still stretch far past the target window.
Best Profiling Approach
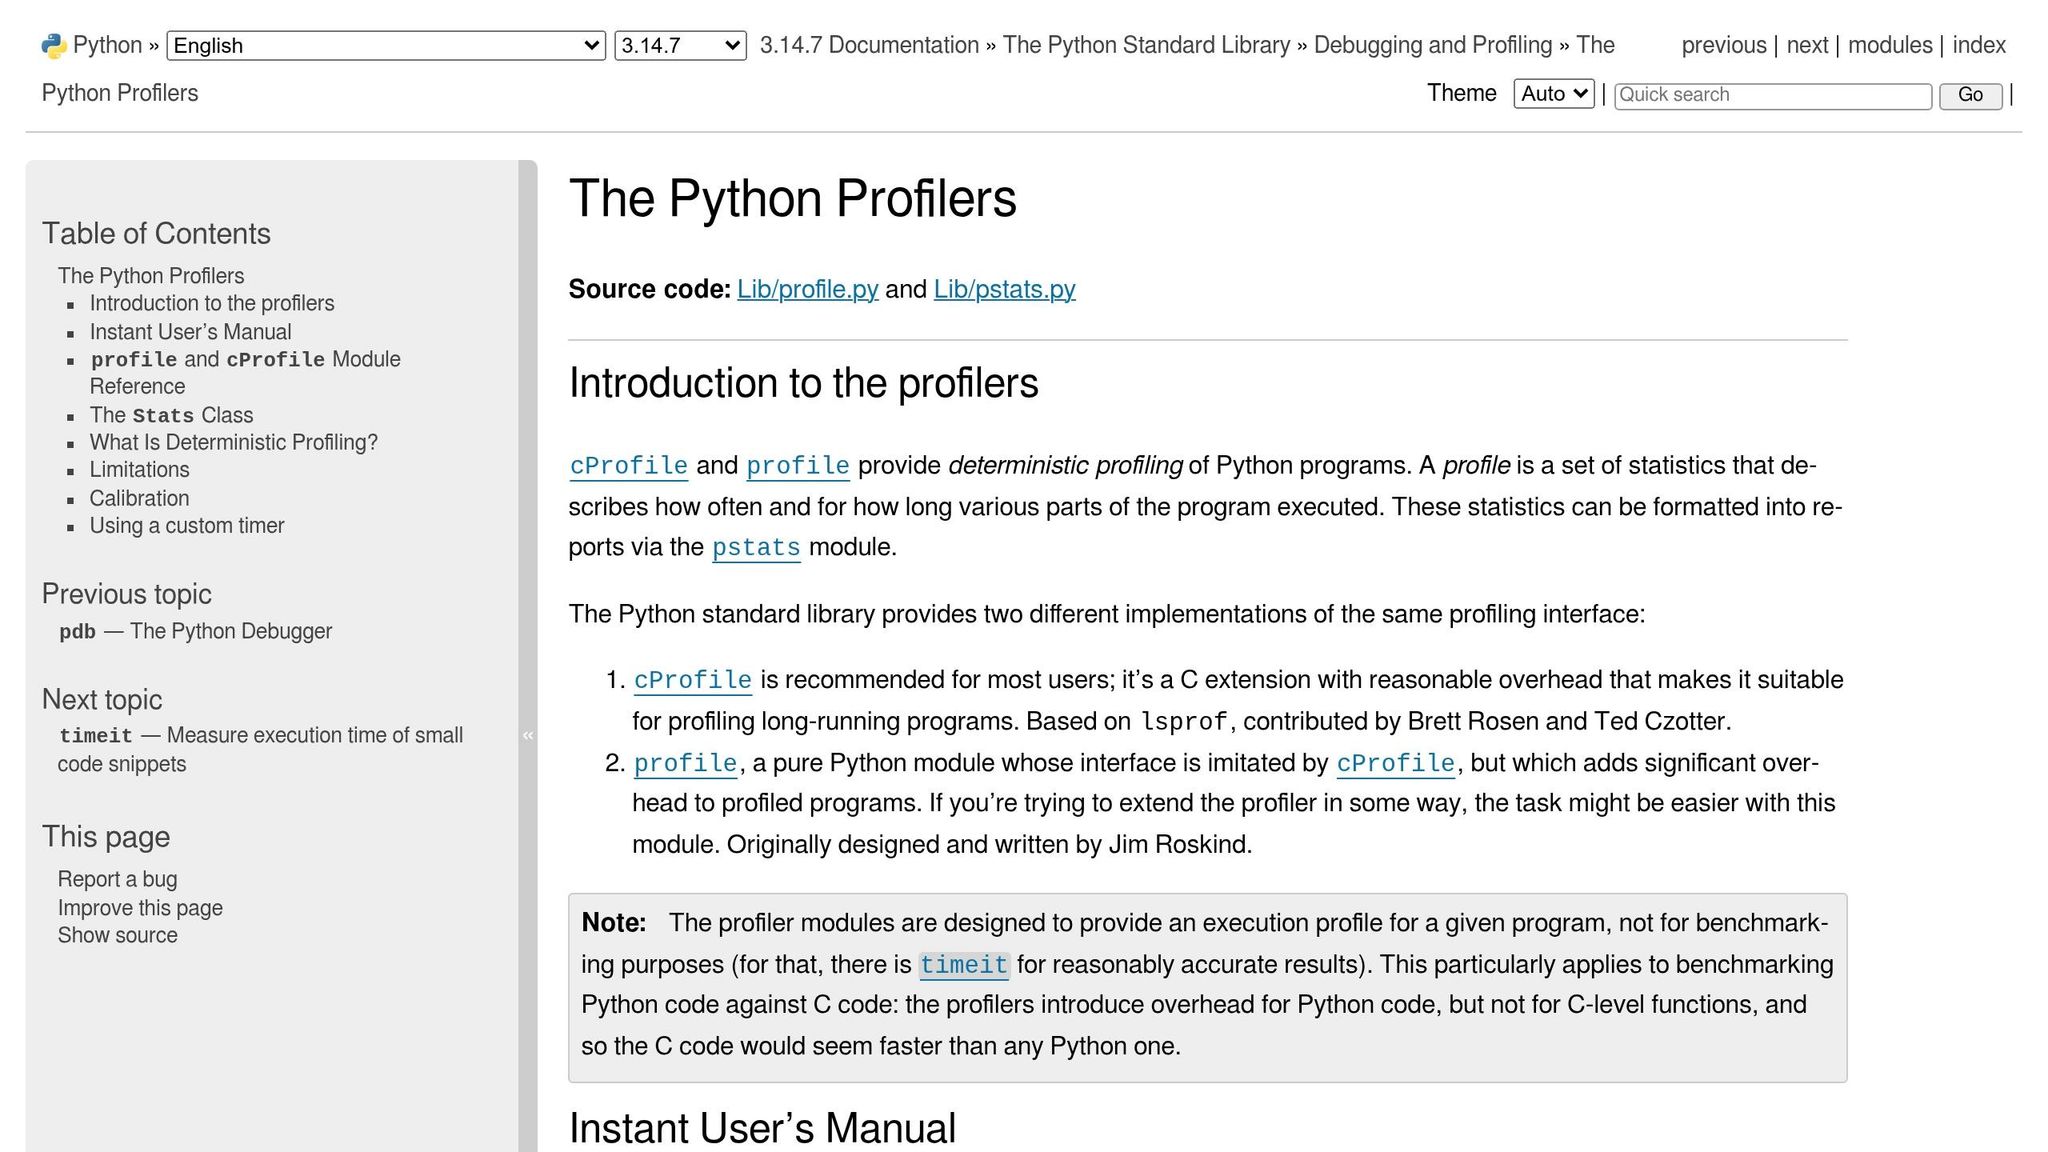
Start with the orchestrator’s task-duration breakdown. That usually tells you where to look first without much guesswork. Then use cProfile or py-spy to find hot functions, and line_profiler to pinpoint slow lines.
For I/O-heavy stages, measure database calls and file reads directly. That matters because a job can look “slow” in Python when the actual delay is happening outside the process.
In one deduplication pipeline, profiling exposed cumulative reprocessing, and a DAG redesign cut runtime from 9.5 hours to 45 minutes.
2. Workers Sitting Idle While the Backlog Grows
Your workers are online and ready, but the queue keeps stretching. CPU stays low across pods while messages stack up in RabbitMQ or Kafka. That usually means the work isn't getting to workers fast enough.
At that point, profiling the task code often misses the mark. The better move is to check where the slowdown starts: dispatch, queueing, or workers waiting on something. In practice, that makes profiling the scheduler, broker, and worker handoff more useful than digging into the task function itself.
Primary Bottleneck Category
This pattern usually points to an orchestration and coordination bottleneck, often tied to I/O or external calls. The workers have room to do more, but the system isn't feeding them well.
A few usual suspects show up again and again:
- A scheduler that can't send tasks fast enough
- A broker that's too small or poorly tuned
- Slow database or API calls that block workers
- Concurrency or rate limits set too tight
Data skew can also throw things off. If partitions are uneven, a small number of workers end up with the heavy chunks while everyone else finishes early and waits around for the slow group to catch up.
Operational Metric to Inspect
Put queue depth, worker CPU and memory, and scheduling latency on the same dashboard. That combo tells the story fast. You also want task scheduling latency: the time between task creation and worker start. If that gap is large, the scheduler or broker is likely the weak point. And if the gap keeps growing, profile dispatch and broker latency before you add more workers.
For Kafka-based pipelines, watch records-lag-max and poll-idle-ratio-avg. A poll-idle-ratio-avg near 1.0 means consumers are spending most of their time waiting instead of processing. If lag is rising at the same time, the consumer group isn't keeping up with producers.
Likely Root Cause
Misconfigured concurrency limits can create throttling even when workers are sitting free. Airflow max_active_runs, Celery prefetch_count, or worker concurrency settings that are left too low are common examples.
In one Celery-on-Kubernetes deployment, increasing prefetch_count, loosening concurrency settings, and moving RabbitMQ to higher-throughput storage pushed workers up to 70–80% CPU and cleared the backlog within minutes.
Best Profiling Approach
For this sign, profile the handoff, not the function body.
Start with end-to-end latency tracing in OpenTelemetry or a vendor APM tool. Instrument task creation, queue publish, worker start, and completion. That gives you a straight view of where time is being lost.
Then use py-spy or yappi to check for lock contention or blocking calls in scheduler or dispatcher code. If workers are stuck on external calls, database query logs and HTTP client instrumentation will often show the problem faster than a Python profiler on its own.
When workers sit idle and the backlog keeps growing, the first instinct is often to spin up more workers. But the profile usually points somewhere else: the scheduler, the broker, concurrency tuning, or too much time spent waiting on outside systems.
3. Sudden Memory Spikes and Out-of-Memory Failures
When a pipeline stops slowing down and starts crashing, memory is often the problem. In production, the signal is usually hard to miss. Logs may show MemoryError, OOMKilled, or SIGKILL / exit code -9. Sometimes the same stage fails every night. Other times, one oversized micro-batch is enough to trigger restarts.
What matters most is when memory climbs during the run. That tells you whether you're dealing with a one-off spike from a large file or a deeper issue that will keep showing up.
Primary Bottleneck Category
This is a memory-bound bottleneck. In many Python data pipelines, it gets worse because Python objects carry extra overhead, and tools like pandas often keep data in memory. The limit isn't CPU or disk. It's how much data sits in RAM at the same time.
A good example: one deduplication pipeline tried to hold 50+ terabytes in RAM and failed under memory pressure.
Operational Metric to Inspect
Track resident memory (RSS) per container at 1-minute intervals or finer. If memory jumps close to the limit and stays there, that's a clear warning. You should also check Kubernetes OOM event counts to pinpoint which pipeline stage is failing.
One pattern is especially useful: if a nightly batch used to peak at 4 GB but now reaches 7.8 GB in an 8 GB container, you're dangerously close to repeat failures. Set alerts at 80%–85% of the container memory limit when that level lasts more than 5 minutes. It also helps to watch per-task memory trends over 30 days so you can spot growth before it turns into a crash.
Likely Root Cause
The usual causes are full-dataset loads, large join or pivot intermediates, and oversized Python objects. Pandas documentation says that loading only the columns you need can cut memory usage to about 1/10th of loading the full dataset.
Long-running workers can also drift upward over time. Global caches or reference cycles may block garbage collection, so each new batch starts from a higher baseline than the one before.
That memory shape tells you what to do next. A sharp spike may call for batch-size cuts or a closer look at temporary intermediates. Slow, sticky growth points more toward allocation tracing or snapshot diffs.
Best Profiling Approach
Start with tracemalloc to trace allocations. Then use Memray or Fil to find the peak and the code path behind it. Compare snapshots from before and after the stage. If memory keeps growing, you're likely looking at a leak. If it spikes and then drops, the issue is probably a temporary intermediate.
For pandas-heavy pipelines, df.info(memory_usage="deep") is often the fastest first check. It's simple, and it can surface the issue before you need heavier tooling.
These memory patterns usually line up with a small set of failure modes.
| Memory pattern | What it likely means | Where to look |
|---|---|---|
| Spike, then baseline | Large temporary intermediate (join, concat, serialization) | Stage timing, batch size, DataFrame copies |
| Steady climb across runs | Leak or object retention | Snapshot diffs, GC metrics, teardown paths |
| Process killed with SIGKILL / exit code -9 | Container memory limit breached | Pod logs, Kubernetes OOM events, task heartbeat timeouts |
| Memory stays high after task ends | Objects cached globally or not freed | Reference graphs, long-lived worker state |
4. Retry Storms and Rising Error Rates
When retries take over a run, profile the failure path, not just task duration. Once a pipeline starts retrying the same tasks, things can snowball fast: the same errors repeat, the backlog grows, and end-to-end latency gets worse even though workers still look busy. That’s the trap. Retries can mask the actual choke point by multiplying failed work. One shaky dependency can eat up capacity across the whole pipeline.
With just 3 retries across 3 service layers, a single failing request can trigger up to 27 downstream calls.
Primary Bottleneck Category
This pattern usually means the slow point sits outside the Python function itself. In most cases, retry storms point to an external dependency or I/O issue: a database, API, object store, or broker that’s timing out or failing for short periods. The task code may be fine on its own, but the retry policy turns downstream instability into repeated load.
Operational Metric to Inspect
These metrics help separate one-off failures from system-wide instability:
- Retry count per task shows which tasks are failing again and again
- Retry-to-success ratio surfaces instability before throughput starts to fall
- Error rate by type helps split data quality issues from system failures
- Timeout rate points to slow dependencies
- Queue/backlog growth, including DLQ backlog, shows whether failures are piling up
- Downstream response time helps pinpoint which external systems are lagging
Likely Root Cause
If retries cluster in one pipeline stage, the cause is often a skewed partition, a slow API endpoint, schema mismatches, permission failures, data quality exceptions, or a transformation that sometimes runs past its resource limits. If error spikes show up on a regular cadence, that often points to synchronized retries without jitter. In plain English, many workers fail, wait the same amount of time, and then hammer the same dependency all at once - a classic thundering herd.
Best Profiling Approach
Distributed tracing is the best place to start. Tools like OpenTelemetry with Jaeger let you trace where retries begin and how latency builds across workers and downstream services. Pair tracing with structured logging that records the retry attempt number, exception type, delay, and downstream endpoint. If you think the task logic itself is slow before it fails, add stage-level or function-level profiling and exception sampling next to tracing. Then review DLQ samples and group failures by error type so you can split data quality problems from system problems.
| Retry pattern | What it likely means | Where to look |
|---|---|---|
| Spikes at regular intervals | Synchronized retries without jitter | Retry policy config, backoff settings |
| Retries concentrated in one stage | Skewed partition or failing dependency | Dependency latency, stage-level traces |
| DLQ backlog growing steadily | Max retry limit hit, systemic failure | DLQ samples, error type distribution |
| Retry-to-success ratio rising | Latent instability, not yet visible in throughput | Per-task retry counts, timeout rate |
5. Slow Task Startup and Long Queue Waits
When workers are available but tasks still sit around waiting, the issue usually moves from execution to dispatch. In plain English: the task logic may be fine, but something is slowing down the path between queued and started.
In Airflow, this often shows up as a big gap between queued_dttm and start_date. In Celery, you may see queue depth keep climbing while worker use barely moves. That's the tell. Your workers aren't pinned on CPU or memory, but end-to-end latency still gets worse. Jobs land late, and downstream data freshness starts to drift.
Primary Bottleneck Category
This symptom usually points to scheduler delay, cold starts, or setup overhead rather than the compute-heavy part of the job. A few common causes show up again and again:
- An overloaded or misconfigured task scheduler
- Slow container or VM spin-up
- Repeated imports, dependency loading, or connection setup
Cold starts alone can add minutes before a task does any real work. That's why profiling matters here. You need to pin down whether the delay happens in the queue, during worker launch, or inside worker setup.
Operational Metric to Inspect
The main metric to check is queue wait time: the gap between when a task is enqueued and when a worker actually begins running it. Put that next to queue depth over time. If queue depth keeps growing while worker CPU stays low, you're probably dealing with a scheduling or startup issue, not a compute shortage.
It also helps to watch autoscaler reaction time. If scale-out trails incoming work, startup delay can end up driving most of the total latency. Once you've confirmed the wait is real, split the problem into two parts: scheduler delay vs. cold-start overhead.
Likely Root Cause
Poor startup design can stack delay on top of delay. Fresh containers, repeated imports, and repeated connection setup can make startup take longer than the task itself. That's a rough trade-off, especially for short jobs.
Best Profiling Approach
Start by logging timestamps across each phase of the task lifecycle:
- Job created
- Task enqueued
- Worker received
- Processing started
- Finished
Those deltas make the problem hard to argue with. They show whether the time is being burned in queue wait or in actual execution.
From there, use distributed tracing and create spans for queue wait, worker init, and task execution across service boundaries. For Python-specific startup cost, run pyinstrument on the worker process to measure import time and connection setup. If queue growth is the main issue, treat it like backpressure. Check concurrency limits, autoscaler thresholds, and whether pre-warmed workers can cut cold-start delay.
If startup delay is the bottleneck, the next step is to figure out whether capacity, orchestration, or environment setup is causing it.
6. Falling Throughput and Growing Data Freshness Lag
When tasks still finish, but every run wraps up later than it should, you're usually looking at a pipeline-wide throughput problem, not just a slow task here or there. The system is processing data more slowly than new data arrives. Once that starts happening, backlog builds fast. You’ll usually see it first in throughput numbers, and then in freshness lag.
Primary Bottleneck Category
Common causes include slow transforms, I/O delays, low parallelism, skew, and an autoscaling mismatch.
Operational Metric to Inspect
The clearest sign is simple: input rate stays higher than processed rate. Track processedRowsPerSecond against inputRowsPerSecond. If the processed rate remains below the input rate across multiple windows, the pipeline is falling behind.
Throughput alone doesn’t tell the whole story, though. You also want to watch backlog depth and freshness lag, especially the time it takes before downstream systems can use the data. In practice, p95 and p99 freshness matter more than averages.
Likely Root Cause
This often comes down to code-level slowdowns, data volume growth without enough worker capacity, upstream or downstream service delays, or skewed workloads that dump too much work onto a small number of partitions.
Another common issue is cumulative merge logic that keeps reprocessing old data instead of limiting work to new arrivals. That can drag down throughput even when each individual run looks fine on the surface.
Best Profiling Approach
A good way to debug this is to split the pipeline into ingestion, transformation, and loading stages, then measure throughput and latency at each boundary. That gives you a plain view of where the slowdown starts.
For the slowest stage, use tools like cProfile, Pyinstrument, or py-spy to find hot functions and costly per-record work. If a step is I/O-heavy, add distributed tracing with OpenTelemetry or Jaeger so you can see how much time is spent waiting on outside systems.
If the issue is tied to reprocessing or orchestration, profile the DAG itself. That often shows where you should batch work, vectorize logic, parallelize execution, or rework the flow. Start with the slowest stage first, then follow the drop in throughput across ingestion, transform, and load.
7. Persistent Resource Underuse or Overuse
If CPU sits near 100% or near idle while deadlines still slip, the pipeline and its resource plan are out of sync. That usually means the issue isn’t one broken task. It’s the way the whole system is sized and run. Profiling helps sort out where the drag comes from: compute, I/O, or orchestration. If the first six signs suggest a broad mismatch, this check tends to confirm it.
Primary Bottleneck Category
Persistent underuse usually points to I/O, orchestration, or strict concurrency caps. Persistent overuse usually points to CPU-heavy code, memory-heavy data structures, or contention.
Operational Metric to Inspect
Start with CPU and memory use per worker over time. Sustained CPU below 20% during scheduled batch windows, while queue depth stays above zero, is a classic underuse pattern. Sustained CPU above 85–90%, especially when queue wait times grow and SLAs slip, points to overuse.
In Kubernetes, persistent throttling can also mean CPU limits are set too tight, not that the workload itself is too heavy.
Likely Root Cause
This sign is less about one bad task and more about whether the pipeline is sized the right way.
For underuse, common causes include:
- Overprovisioned instances
- I/O-bound tasks waiting on slow external APIs or object storage
- DAGs set with concurrency limits far below what the infrastructure can handle
Kubernetes workloads are often overprovisioned, which leaves CPU and memory idle.
For overuse, check for large in-memory DataFrames, row-by-row loops, and repeated reprocessing of the same data.
Best Profiling Approach
Start with worker-level trends, then drill into task-level traces. Use cloud monitoring dashboards like AWS CloudWatch, Datadog, or Prometheus/Grafana to get a time-series view of CPU, memory, disk I/O, and network use lined up with your DAG schedule.
If CPU is low but jobs are still slow, add distributed tracing with OpenTelemetry. That helps you see how much time tasks spend waiting on external calls versus how much time they spend running Python code.
For overuse, use cProfile or Pyinstrument to find the hottest functions. Then use memory_profiler or Scalene for line-by-line memory tracking. Once you know whether the pressure is in code, I/O, or orchestration, the next profiling step becomes much clearer.
Symptom-to-Bottleneck Reference Table
Use this table as a quick triage step for the seven warning signs. It links each signal to the bottleneck that’s most likely in play, plus the first thing to check.
| Warning Sign | Primary Bottleneck | Key Metric | Likely Cause | First Profiling Step |
|---|---|---|---|---|
| Batch runs keep getting longer | Compute or I/O | Runtime; per-stage duration | Inefficient transforms, slow I/O, or data volume growth | Stage timing breakdown; cProfile for CPU hotspots; I/O wait analysis |
| Workers idle while backlog grows | Scheduling or parallelism | Worker utilization; queue depth | Poor partition sizing, serial bottlenecks, or low concurrency limits | Orchestration traces; task graph review; worker-level timelines |
| Sudden memory spikes / OOM failures | Memory | Peak resident memory; garbage collection pressure | Large in-memory materializations, unnecessary DataFrame copies, or oversized batches | Memory profiler such as Memray or Fil; allocation tracing; batch-size experiments |
| Retry storms and rising error rates | Reliability or dependency | Retry count; failure rate; extra runtime | Unstable downstream services, rate limits, or overly aggressive retry logic | Exception tracing; dependency latency analysis; idempotency checks |
| Slow task startup / long queue waits | Orchestration or infrastructure | Queue wait time; cold-start latency | Heavy Python imports, cold starts, or scheduler contention | Measure startup overhead separately from execution time; scheduler logs |
| Falling throughput / freshness lag | Capacity or scaling | Records processed per minute; source-to-availability lag | Under-provisioned workers, single-threaded code, or inefficient joins and shuffles | Throughput by stage; partition balance check; scaling efficiency review |
| Persistent resource underuse or overuse | Compute or capacity | CPU per worker over time; cost per run | Overprovisioned instances, tight concurrency caps, or CPU-heavy code paths | Cloud monitoring dashboards such as CloudWatch, Datadog, or Prometheus; compare actual usage with capacity limits |
Start broad. Then drill into the stage that lines up with the symptom. For those new to these concepts, a data engineering boot camp can provide the foundational knowledge needed to manage these bottlenecks.
Conclusion
Put together, these signs usually trace back to a small group of bottlenecks. In most cases, the trouble comes from runtime, queueing, memory, retry, startup, throughput, or capacity limits.
Profiling helps because it shows which layer is slowing the pipeline down. The process is simple: measure, isolate the bottleneck, fix the highest-impact constraint, and measure again. In many production pipelines, the bottleneck shifts over time between code, orchestration, infrastructure, and external dependencies.
For hands-on practice, DataExpert.io Academy offers training in data engineering, analytics engineering, and AI engineering.
FAQs
How do I know which signal to check first?
Start with the signal that best matches the likely bottleneck.
For slow queries, open the Query Profile and look at the nodes using the most resources or taking the most time. That usually gets you to the problem faster than scanning everything top to bottom.
For ETL pipelines, begin with a baseline using record counts. Then check throughput, latency, and error rates. If the counts look off, that’s your first clue. If the counts are fine but processing slows down, the issue is more likely in pipeline performance.
In distributed systems like Spark, look at stage durations and focus on the slowest stage. That’s often where skew shows up. One slow stage can hold up the whole job, like a traffic jam caused by a single blocked lane.
In Airflow, start with the task logs. Check for exit codes such as -9 or -15 first. Those can point to memory pressure or timeouts, which gives you a much clearer direction for the next step.
Which profiler is best for CPU, memory, or I/O issues?
Use a sampling profiler that tracks CPU time and memory pressure signals. In data-heavy Python pipelines, Spark UI is usually the best pick because it shows executor memory usage, GC time, and shuffle spill or disk activity.
For ML-focused pipelines, TensorFlow Profiler helps you spot input or data I/O bottlenecks. PyTorch Profiler is a better fit for distributed setups that run into communication or memory problems.
When should I profile the pipeline instead of changing code?
Profile first when you can’t tell which stage is burning time, or when a quick code tweak might hit the wrong bottleneck.
Do it when you see:
- long batch runs
- high worker idle time or scheduling delays
- memory spikes, frequent GC, or disk spillage
- retry storms, queued task buildup, or slow task startup
Start with a baseline of current settings and metrics before you change code or configuration.