
Snowflake Bottlenecks: Troubleshooting Tips
Snowflake bottlenecks can spike costs and slow down workflows if not addressed. The root causes often include inefficient queries, poor memory management, and overloaded warehouses. You can master data engineering to better diagnose and resolve these issues:
- Identify bottlenecks using Snowflake's Query Profile to spot resource-heavy operations like full table scans or disk spillage.
- Optimize query structure by removing redundant operations, avoiding
SELECT *, and applying filters early. - Improve data loading by fine-tuning the
COPYcommand, splitting large files, and cleaning up staging areas. - Scale warehouse resources effectively by matching size to workload needs and monitoring usage patterns.
- Set up monitoring and alerts to track performance and avoid disruptions.
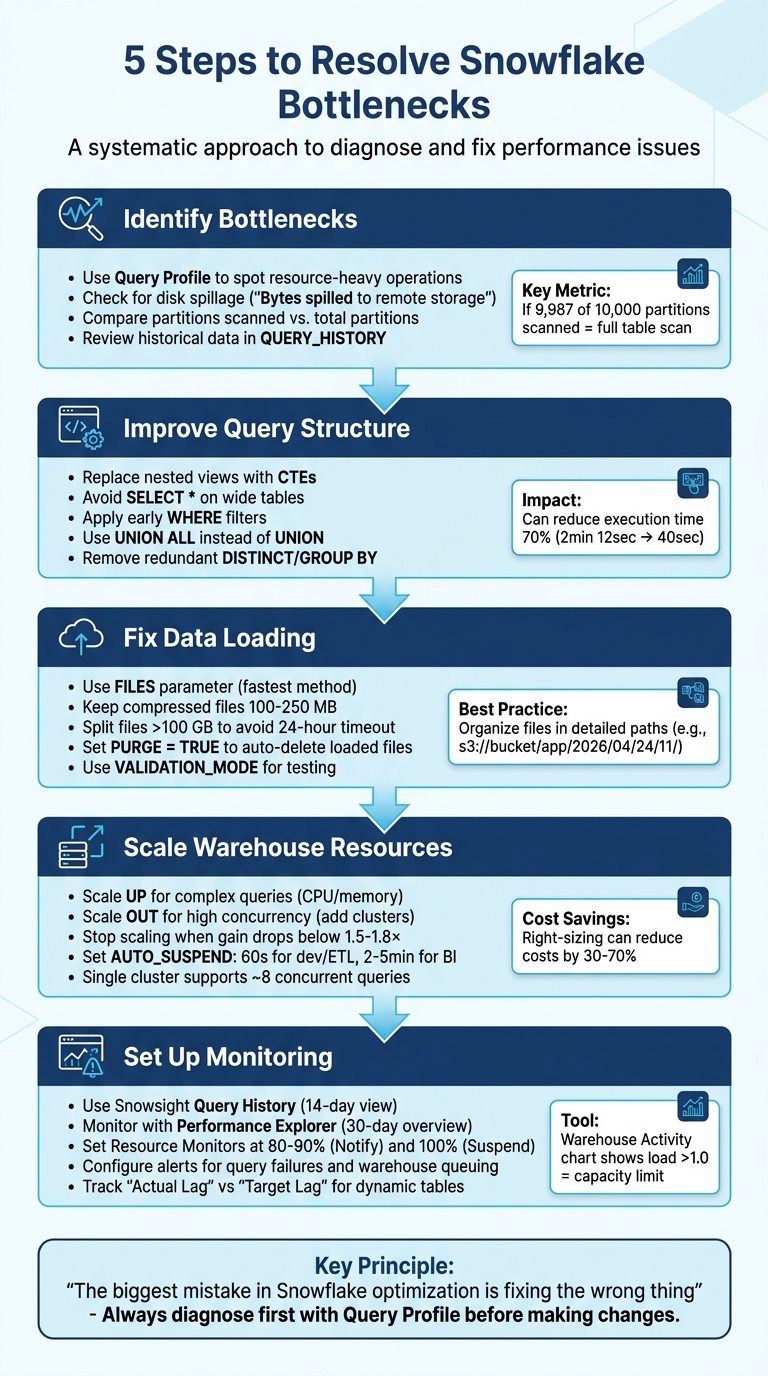
5-Step Process to Troubleshoot Snowflake Performance Bottlenecks
Step 1: Identify Bottlenecks Using Snowflake Query Profile
How to Access and Read Query Profile
To access the Query Profile, navigate to Monitoring > Query History in Snowsight. Select a specific Query ID, then click on the Query Profile tab to dive into the query execution details. Ian Whitestone, Co-founder and CEO at SELECT, emphasizes its importance:
"The Snowflake Query Profile is the single best resource you have to understand how Snowflake is executing your query and learn how to improve it."
The Query Profile provides a Directed Acyclic Graph (DAG) with operator nodes like TableScan, Join, and Aggregate. Darker nodes indicate operations that consume more resources, helping pinpoint high-cost steps. Additionally, the Most Expensive Nodes pane highlights operators that account for at least 1% of the total execution time, making it easier to identify resource-heavy processes.
The Profile Overview further breaks down execution time into categories like Processing, Local Disk I/O, Remote Disk I/O, Network Communication, Synchronization, and Initialization. A key metric to watch is "Bytes spilled to remote storage", which signals when queries exceed memory limits and spill data to slower cloud storage. This is a red flag for memory-related inefficiencies. Pair this metric with operator-level statistics to identify the steps causing spillage and determine whether to resize your warehouse or restructure the query.
For TableScan operators, compare Partitions scanned with Partitions total. For example, if 9,987 out of 10,000 partitions are scanned, it indicates a full table scan, which suggests poor pruning efficiency. Consider this case: in August 2024, Greybeam optimized a query processing 600 million rows. The Query Profile showed that a WindowFunction operation consumed 79.7% of the execution time and caused 15.61GB of spillage to local storage. By pushing filters down and using an EXISTS clause, they reduced rows processed by 480 million, cutting execution time from 2 minutes 12 seconds to 40 seconds and lowering spillage from 15.61GB to 1.02GB.
Analyze Performance Trends with Historical Data
While individual query analysis is helpful, reviewing historical data can uncover recurring performance issues. After examining specific queries, look at long-term trends using SNOWFLAKE.ACCOUNT_USAGE.QUERY_HISTORY. This view tracks metrics like PARTITIONS_SCANNED, PARTITIONS_TOTAL, BYTES_SPILLED_TO_REMOTE_STORAGE, and TOTAL_ELAPSED_TIME over the past 365 days.
Keep in mind that this view has a latency of up to 45 minutes, whereas Snowsight offers near real-time data for queries executed in the last 14 days. If you notice consistently high "Queued" times for queries, it may indicate that your warehouse is overloaded and could benefit from multi-cluster scaling or redistributing workloads. Kevin Ruan from Snowflake provides a useful tip:
"If a query is spending more time compiling (COMPILATION_TIME) than executing (EXECUTION_TIME), perhaps it is time to review the complexity of the query."
Use historical data to establish performance baselines for critical queries. By tracking average execution times, spotting queries with increasing runtimes, and monitoring warehouse usage patterns, you can address bottlenecks before they disrupt production workflows.
sbb-itb-61a6e59
Step 2: Improve Query Structure
Eliminate Nested Views and Redundant Operations
Overly complicated queries with multiple nested views can confuse Snowflake's optimizer, leading to slower performance. To address this, simplify your query logic by replacing nested views with Common Table Expressions (CTEs) or temporary tables. This not only makes the query easier to read but also improves execution efficiency.
Another common issue is the use of redundant operations. For example, adding DISTINCT or GROUP BY clauses when they don’t actually change the final row count wastes compute resources. Always double-check whether these clauses are necessary before including them. Similarly, when merging datasets, opt for UNION ALL instead of UNION to skip the costly duplicate-checking process.
For deduplication, try using QUALIFY ROW_NUMBER() OVER (...) = 1 instead of relying on DISTINCT. This method gives you better control over which duplicate to keep and often results in faster execution. Additionally, materializing complex expressions can further enhance query performance.
Once the query structure is optimized, the next step is to focus on cutting down I/O overhead to speed up execution.
Minimize I/O with Better Query Design
After cleaning up the structure, you can further improve performance by designing queries that reduce unnecessary I/O.
Avoid using SELECT * on wide tables, as this can result in scanning irrelevant columns and increase disk usage. Instead, only select the columns you need. Use the Query Profile tool to identify and address areas contributing to high I/O overhead.
Another critical optimization is applying early WHERE filters. For instance, write filters like WHERE order_date >= '2026-01-01' instead of wrapping columns in functions like WHERE YEAR(order_date) = 2026. This allows Snowflake to prune micro-partitions effectively, speeding up query execution.
Be cautious with joins - ensure that keys are properly matched to avoid accidental Cartesian products, which can drastically inflate row counts and compute costs. If you find yourself referencing an expensive CTE multiple times, materialize it into a temporary table to save on repeated computations. Finally, keep an eye on the Query Profile for disk spillage. When intermediate results exceed your warehouse's memory, they spill to slower storage, potentially increasing query times by up to 10x.
Step 3: Fix Data Loading and Staging Bottlenecks
Configure the COPY Command for Faster Bulk Loads
Fine-tune your COPY command to speed up data ingestion. Start by selecting the most efficient file selection method. Using the FILES parameter with a list of up to 1,000 files is the fastest option, while the PATTERN parameter with regular expressions tends to be slower. If you're loading files from a specific folder, narrow the scope by specifying a targeted path or prefix instead of scanning everything.
Keep compressed files sized between 100 MB and 250 MB. For files larger than 100 GB, split them into smaller chunks to avoid timeouts and distribute the workload. Snowflake's documentation reminds us:
"the number of load operations that run in parallel can't exceed the number of data files to be loaded".
Splitting files larger than 100 GB also helps prevent the 24-hour timeout that cancels a load operation without committing any data.
Organize files into detailed paths (e.g., s3://bucket/app/2026/04/24/11/) to enable concurrent COPY operations and reduce the overhead caused by scanning S3 directories. Always use the PURGE = TRUE option to automatically delete files after a successful load. This avoids repeated file scans for duplicates, keeping performance optimal.
To test your load process without inserting data or using credits, set VALIDATION_MODE = RETURN_ALL_ERRORS. For specific file types, apply these settings:
- For CSV files with leading spaces: TRIM_SPACE = TRUE
- For JSON files: STRIP_NULL_VALUES = TRUE
These configurations save storage space and improve query performance downstream.
Once you've optimized your COPY command, turn your attention to addressing issues in the staging environment.
Resolve Staging Area Problems
A well-organized staging environment is key to maintaining consistent performance. Here are some common issues and their solutions:
-
Integration Errors: If you see an "Integration not found" error after recreating a storage integration, it's likely due to a change in the hidden ID. Re-establish the link by running the following command:
This ensures the stage is correctly linked to the updated integration.ALTER STAGE <name> SET STORAGE_INTEGRATION = <integration_name> - File Accumulation: Retaining loaded files can slow down performance because Snowflake will re-scan them during every load. While Snowflake prevents duplicate loading for 64 days using metadata, it's a good practice to clean up. Use PURGE = TRUE to remove files automatically after a successful load or manually execute the REMOVE command to clear the staging area.
- File Size Optimization: Combine smaller files into the ideal range of 100–250 MB to reduce overhead. For uncompressed CSV files larger than 128 MB, set MULTI_LINE = FALSE and COMPRESSION = NONE to allow parallel scanning.
Lastly, ensure your warehouse is operational by using the command:
ALTER WAREHOUSE <name> RESUME
This process may take up to five minutes. Monitor LOAD_HISTORY for any partial loads or failures - Snowflake retains this data for 14 days, giving you ample time to troubleshoot.
The Missing Manual: Everything You Need to Know about Snowflake Optimization | SELECT
Step 4: Scale Snowflake Warehouse Resources
Once you've fine-tuned query structures and optimized data loads, the next step is scaling Snowflake resources to handle increased workload demands effectively.
Size Warehouses to Match Workload Needs
The key to scaling warehouses is understanding whether your bottleneck stems from query complexity or user concurrency. If complex queries are slowing things down, scale up by increasing CPU and memory. On the other hand, if multiple users running queries at the same time is the issue, scale out by adding clusters to handle the load.
To determine if your warehouse is memory-bound, check the Query Profile for "Bytes spilled to local/remote storage." If you see values greater than zero, scaling up vertically could improve performance. However, stop increasing the warehouse size once doubling it no longer delivers a 1.5× to 1.8× performance gain relative to its cost.
"The goal is not to use the smallest warehouse possible, but to use the smallest warehouse that completes queries without spilling or missing performance SLAs." – Snir Siboni, Seemore Data
Different workloads often require dedicated warehouses. For instance:
- Use an X-Small warehouse for development.
- Assign a Large warehouse for ETL processes.
- Opt for a Medium warehouse for BI reporting.
For multi-cluster warehouses managing high concurrency, Snowflake offers two scaling policies:
- Standard Policy: Adds clusters after about 20 seconds of query queuing.
- Economy Policy: Waits roughly 6 minutes before adding capacity.
Keep in mind that a single-cluster warehouse typically supports up to 8 concurrent queries. Balancing warehouse size and workload distribution is crucial for maintaining efficiency.
Control Costs While Maintaining Performance
Snowflake enforces a 60-second minimum credit charge whenever a warehouse starts or is resized. To avoid wasting credits, configure AUTO_SUSPEND settings based on workload type:
- Set it to 60 seconds for development and ETL tasks.
- Use a 2–5 minute interval (120–300 seconds) for BI and reporting workloads to keep the cache warm for concurrent users.
Monitor your warehouse usage with the avg_running metric in the WAREHOUSE_LOAD_HISTORY view. If this metric consistently shows low values (below 2–3), your warehouse might be over-provisioned. To identify queuing issues, run this query:
SELECT warehouse_name, SUM(avg_running) AS total_running, SUM(avg_queued_load) AS total_queued
FROM snowflake.account_usage.warehouse_load_history
WHERE start_time >= DATEADD(month, -1, CURRENT_TIMESTAMP())
GROUP BY warehouse_name
HAVING SUM(avg_queued_load) > 0;
Right-sizing and separating workloads can reduce Snowflake costs by as much as 30% to 70%. Additionally, you can use Snowflake tasks to automatically resize warehouses during peak business hours and scale them down during quieter periods.
When choosing between Gen1 and Gen2 warehouses, consider the workload:
- Gen1: Ideal for simple SELECT queries.
- Gen2: Better suited for heavy DML operations and large-scale aggregations, offering 20–60% performance gains but at a 25–35% higher cost per hour.
Step 5: Set Up Monitoring and Alerts
After optimizing queries and warehouses, maintaining a watchful eye on performance is key. Continuous monitoring ensures you can quickly address any bottlenecks before they escalate into service disruptions. Without proper alerts, critical issues might slip by unnoticed.
Use Snowflake's Monitoring Tools
Snowflake offers several built-in tools to help you keep tabs on your pipeline's performance. One of the most useful is Snowsight Query History, which provides a 14-day snapshot of all executed queries. You can filter these by status, warehouse, or duration, and enabling "Auto Refresh" updates the data every 10 seconds - perfect for troubleshooting live issues.
For a more comprehensive look at warehouse performance, the Performance Explorer dashboard is invaluable. It tracks key metrics like failures, retries, query blocking, and runtime stats such as duration and throughput. This dashboard gives you a 30-day overview, making it easier to spot patterns and trends across your account.
Another helpful tool is the Warehouse Activity chart in Snowsight. This bar chart breaks down query load into running, queued (overload), queued (provisioning), and blocked queries. If the load value consistently exceeds 1.0, it’s a sign your warehouse is hitting its capacity limits.
With these tools in place to monitor trends, the next step is to ensure you're alerted when critical events occur.
Configure Alerts for Critical Events
Automated alerts are essential for proactive monitoring, notifying you immediately when something critical happens. Snowflake Alerts can track conditions like warehouse credit spikes or pipeline failures. If you're monitoring specific events in tables or views, it's better to use "Alerts on New Data" instead of scheduled alerts. This reduces latency and avoids unnecessary warehouse costs.
Resource Monitors are another useful feature for managing costs and avoiding bottlenecks. By setting credit quotas, you can configure actions like "Notify" at 80–90% usage or "Suspend" at 100%. This ensures you’re warned before services are disrupted. Keep in mind, though, that a single resource monitor can manage up to 500 warehouses.
For dynamic tables and tasks, enabling telemetry logging is critical. Set LOG_LEVEL to at least ERROR and LOG_EVENT_LEVEL to ERROR or WARN so that major issues are recorded in event tables for alerting. Additionally, monitoring "Actual Lag" versus "Target Lag" helps identify performance issues caused by upstream dependencies or underpowered warehouses.
For immediate responses to pipeline failures, integrate alerts with communication tools like Slack using Webhook Notifications. If your monitoring needs are less frequent, Serverless Alerts can help you avoid the one-minute minimum credit charge that comes with virtual warehouses.
| Alert Type | When to Use | Key Benefit |
|---|---|---|
| Resource Monitor | Manage warehouse credit consumption | Prevents overspending with automated actions |
| Query Failure Alert | Track task errors or query failures | Quickly identifies pipeline breaks |
| Queuing Alert | Detect warehouse overload | Signals when to scale up or add clusters |
| Lag Alert | Monitor dynamic table freshness | Ensures data meets required SLAs |
Conclusion
When it comes to fixing Snowflake bottlenecks, the first step is always diagnosis. As Nikesh Vora, Technical Product Manager at Coefficient, aptly states:
"The biggest mistake in Snowflake optimization is fixing the wrong thing".
Start by leveraging the Query Profile to pinpoint high-impact issues. These might include excessive I/O due to poor partition pruning, memory problems leading to disk spillage, or exploding joins caused by missing keys. Once you've identified the root cause, you can apply specific fixes - like avoiding SELECT *, using early filters on clustered columns, or replacing inefficient OR statements with UNION. For data ingestion, refine your queries and adjust COPY command configurations to ensure smooth processing. Addressing memory inefficiencies, such as disk spillage, is particularly critical since these can significantly slow execution. And remember, resizing your warehouse should only come after you've optimized your workload.
Making targeted optimizations not only improves performance but also reduces compute costs. With Snowflake's pay-as-you-go model, every performance boost translates directly into savings. As DataCouch puts it:
"Every optimization you make is a direct saving... you're actively managing your cloud spend and improving your company's bottom line".
For example, switching from full-refresh models to incremental processing can dramatically cut down resource usage - processing only 1 million changed rows instead of rebuilding 200 million rows. These strategies lay the groundwork for effective and ongoing performance tuning.
To ensure your optimizations remain effective, continuous monitoring is key. Set up resource monitors to catch runaway costs, configure alerts for events like query failures or warehouse queuing, and track performance trends over time. While Snowflake is designed to be fast by default, Yaniv Leven from Seemore Data offers a critical reminder:
"Snowflake will dutifully run whatever you ask of it even wildly inefficient plans, sooo performance is on you!".
For those looking to deepen their expertise, additional resources and training are available through the DataExpert.io Academy (https://dataexpert.io).
FAQs
How do I know if my bottleneck is query design or warehouse sizing?
To figure out whether the bottleneck lies in query design or warehouse sizing, start by observing performance changes. If boosting the warehouse size leads to a noticeable improvement in query performance, the issue is probably tied to resource limitations. However, if performance remains sluggish, the problem is likely due to inefficient query design - such as queries scanning excessive amounts of data.
Leverage query profiling tools to identify specific slowdowns and make the necessary adjustments to your queries. Remember, increasing warehouse size is only effective if resource constraints are the root cause of the issue.
What Query Profile signals should I check first for slow queries?
To address slow queries, begin by analyzing the Query Profile. Look for nodes or operators that show the highest total elapsed time or resource usage. Pay close attention to resource-heavy nodes such as TableScan, Sort, Join, or Aggregate, as these typically account for the majority of the execution time. Pinpointing these areas will reveal where the query is using up the most time and resources.
When should I scale up vs add clusters to reduce queuing?
When working with Snowflake, deciding whether to scale up or add clusters depends on the specific demands of your workload. If your queries are CPU or memory-intensive - such as complex data transformations - scaling up (increasing the size of your warehouse) can improve the speed of individual queries. On the other hand, for workloads with high concurrency, adding clusters through multi-cluster warehouses is the way to go. This approach helps manage traffic spikes and minimizes query queuing. Keep an eye on your workload patterns to determine the best strategy for optimizing performance.