
How to Optimize Query Concurrency in Snowflake
Struggling with slow queries in Snowflake? When multiple users or apps run queries at the same time, your Snowflake warehouse can hit performance bottlenecks. Here's the deal: Snowflake's compute resources are shared, and when too many queries compete for them, things slow down - or worse, queries get stuck in a queue.
To fix this, you need to manage query concurrency effectively. This guide covers the essentials:
- Adjust concurrency settings (
MAX_CONCURRENCY_LEVEL) to control how many queries run simultaneously. - Use warehouse auto-scaling to handle spikes in query load without wasting credits.
- Monitor for issues like memory spillage or query queuing using Snowflake tools like Snowsight and Query History.
- Apply clustering keys and materialized views to speed up query execution.
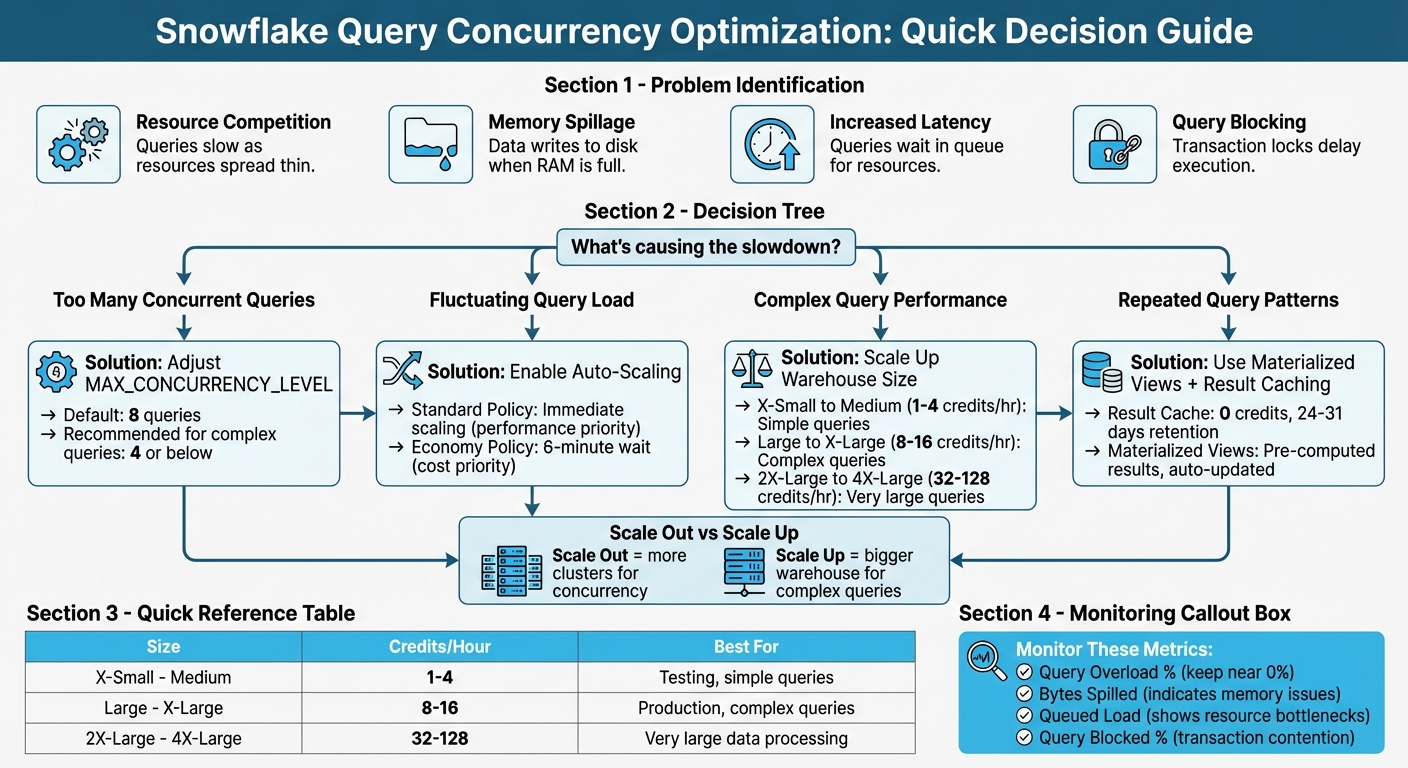
Snowflake Query Concurrency Optimization Decision Framework
What is Query Concurrency in Snowflake
Query Concurrency Defined
Query concurrency in Snowflake refers to multiple queries running simultaneously on a single virtual warehouse, all sharing the same compute resources. Think of it like a highway with a fixed number of lanes: as more cars (queries) enter, traffic slows down.
Each virtual warehouse in Snowflake is equipped with a specific allocation of CPU and memory. For instance, if two queries are running, each gets about half of the compute resources; with ten queries, each query receives roughly one-tenth. While this setup works well under light workloads, performance can drop significantly as the number of concurrent queries increases.
By default, Snowflake limits concurrent queries to 8 per warehouse, controlled by the MAX_CONCURRENCY_LEVEL parameter. The workload on a warehouse is measured by dividing the total execution time of all queries by the monitoring interval. This helps assess how heavily the warehouse is being utilized. These dynamics often lead to specific challenges when concurrency levels rise.
Common Problems with High Concurrency
Sharing resources among multiple queries can lead to several performance issues.
The first challenge is resource competition. When too many queries compete for the same compute pool, execution slows down as resources are spread thin. This creates a bottleneck, forcing some queries to wait their turn instead of running immediately.
Another issue is memory spillage. If concurrent queries use up all available RAM, Snowflake shifts to writing data to disk or remote storage. This shift from in-memory processing to disk-based operations can significantly slow query performance. You can track this issue by monitoring the "percentage of queries with bytes spilled" metric in Performance Explorer.
Increased latency is another symptom of high concurrency. As queries wait in line for resources, the time it takes to get results grows longer. Snowflake's Snowsight interface provides a visual representation of this "queued load" via the Warehouse Activity chart, helping identify when a warehouse is overwhelmed. Additionally, queries might become blocked due to transaction locks on specific resources, further delaying execution.
| Status | Meaning | Impact |
|---|---|---|
| Running | Actively using warehouse resources | High running load creates contention |
| Queued | Waiting for resources due to warehouse overload | Increases total turnaround time |
| Queued (Provisioning) | Waiting for the warehouse to start or resize | Temporary delay during spin-up |
| Blocked | Waiting for a transaction lock on a resource | Indicates contention at the data level |
Tackling High Concurrency with Multi-Cluster Warehouses
How to Configure MAX_CONCURRENCY_LEVEL
The MAX_CONCURRENCY_LEVEL parameter determines how many queries can run simultaneously on a single warehouse cluster. Adjusting this setting redistributes resources, allowing fewer queries to access more CPU and memory. This setup is particularly useful for large or multi-statement queries but may result in queuing additional queries instead. According to Snowflake's documentation, any changes should be tested to confirm consistent performance improvements. This parameter is key to addressing the concurrency challenges mentioned earlier.
Steps to Adjust MAX_CONCURRENCY_LEVEL
Changing the MAX_CONCURRENCY_LEVEL is straightforward using SQL commands. Start by checking the current settings with:
SHOW PARAMETERS IN WAREHOUSE <warehouse_name>;
This command provides details on the current MAX_CONCURRENCY_LEVEL value.
To update the concurrency level for an existing warehouse, use the ALTER WAREHOUSE command. For instance, to set the concurrency level to 4 for a warehouse handling complex BI reports:
ALTER WAREHOUSE my_wh SET MAX_CONCURRENCY_LEVEL = 4;
If you're creating a new warehouse with a specific concurrency level, use:
CREATE WAREHOUSE new_wh WITH MAX_CONCURRENCY_LEVEL = 2;
After making changes, monitor the Warehouse Activity chart in Snowsight to observe running and queued queries.
Guidelines for Setting MAX_CONCURRENCY_LEVEL
Focus on adjusting warehouses that handle resource-heavy workloads where query performance is impacted by contention. For warehouses running simple, quick queries, the default setting usually suffices. Lower the concurrency level to 4 or below only when large queries are struggling due to resource competition. Always test changes in a non-production environment to evaluate their impact on performance.
If reducing concurrency leads to excessive queuing, consider pairing the adjustment with the STATEMENT_QUEUED_TIMEOUT_IN_SECONDS parameter to cancel queries that remain in the queue for too long. Another option is to explore using a dedicated warehouse for resource-intensive tasks or enabling the Query Acceleration Service, which may address performance issues more effectively than limiting concurrency.
| Parameter | Default Value | Purpose |
|---|---|---|
MAX_CONCURRENCY_LEVEL |
8 | Limits concurrent queries per cluster to manage resource allocation |
STATEMENT_QUEUED_TIMEOUT_IN_SECONDS |
0 (No timeout) | Sets the maximum wait time for queued queries before cancellation |
How to Use Warehouse Auto-Scaling and Sizing
Auto-scaling and proper sizing are essential for managing fluctuating query loads in Snowflake. These features ensure your warehouses adapt to demand automatically, balancing performance and cost without manual adjustments.
How Auto-Scaling Works
Snowflake's auto-scaling operates through multi-cluster warehouses, which dynamically add or remove clusters based on query load. This flexibility is controlled by setting MIN_CLUSTER_COUNT and MAX_CLUSTER_COUNT. When queries start queuing or existing clusters hit capacity, additional clusters are spun up. As the load decreases, the extra clusters are shut down.
"In auto-scale mode, Snowflake automatically adds or resumes additional clusters... as soon as the workload increases. If the load subsides again, Snowflake shuts down or pauses the additional clusters." – Artin Avanes, Snowflake
Two scaling policies determine how quickly clusters are added:
- Standard Policy: Starts new clusters immediately when queries queue or resources are insufficient. This is ideal for performance-critical workloads.
- Economy Policy: Adds clusters only if the workload can sustain them for at least six minutes. This option is better for reducing credit usage.
As a starting point, set MIN_CLUSTER_COUNT to 1 and MAX_CLUSTER_COUNT to 2 or 3, and monitor your workload. If queuing frequently occurs during peak times, consider increasing the maximum cluster count. Additionally, align your warehouse size with the complexity of your queries and the volume of data being processed for optimal results.
How to Choose the Right Warehouse Size
While auto-scaling adjusts the number of clusters, the warehouse size dictates the compute power of each cluster. Compute power is measured in credits per hour, with an X-Small warehouse consuming 1 credit per hour and a 4X-Large warehouse using 128 credits per hour.
- Scaling Up: Increasing warehouse size boosts performance for complex queries by providing more compute power.
- Scaling Out: Adding clusters is better for handling high concurrency.
For complex queries, larger warehouses are recommended to avoid memory spillage, which can slow performance significantly. For simpler queries, a Medium or smaller warehouse usually suffices. If you notice queries spilling data to local or remote storage, increasing the warehouse size can help by providing additional memory.
For production environments, a Large or X-Large warehouse is often a good choice. Pair this with per-second billing and auto-suspend settings to control costs. In testing environments or when using the Snowsight UI, smaller warehouses (X-Small, Small, or Medium) are typically enough. To identify resource bottlenecks, monitor the Query Overload % metric in Performance Explorer. If queuing is due to high query volume rather than complexity, a multi-cluster warehouse setup might be more effective than simply increasing warehouse size.
| Warehouse Size | Credits Per Hour | Best For |
|---|---|---|
| X-Small to Medium | 1–4 | Simple queries, testing |
| Large to X-Large | 8–16 | Complex queries |
| 2X-Large to 4X-Large | 32–128 | Very large queries |
How to Manage Query Queuing and Priorities
How Query Queuing Works in Snowflake
When a warehouse runs out of compute resources or hits its concurrency limit, Snowflake places additional queries in a queue. The number of simultaneous queries a cluster can handle is controlled by the MAX_CONCURRENCY_LEVEL setting, which defaults to 8. Once this cap is reached, any new queries must wait in line.
There are two main types of queuing in Snowflake:
- "Queued (Provisioning)" happens when a query waits for a warehouse to start or scale up.
- "Queued" occurs when the warehouse is already running but overloaded, requiring the query to wait for other queries to complete.
For multi-cluster warehouses, Snowflake can automatically add clusters in Auto-scale mode to handle queued queries. However, if the Economy scaling policy is enabled, new clusters will only be added if there’s sufficient workload to keep them active for at least six minutes.
To prevent long waits during peak times, Snowflake cancels queries that exceed the timeout set by STATEMENT_QUEUED_TIMEOUT_IN_SECONDS. You can monitor query queuing through the "Warehouse Activity" chart in Snowsight or by querying the QUERY_HISTORY view, which helps identify spikes in "Queued Load". By understanding these queuing mechanisms, you can better allocate resources and prioritize critical workloads.
How to Set Query Priorities
While Snowflake’s auto-scaling feature adjusts compute resources dynamically, managing query priorities can further enhance performance during high-demand periods. One effective way to minimize delays is through workload isolation, which ensures critical tasks have the resources they need.
Workload isolation involves creating separate warehouses for different types of queries. For example, high-priority workloads should run on dedicated warehouses to avoid competing with ad-hoc or low-priority queries. This method is more effective than trying to prioritize within a single shared warehouse.
For critical workloads, configure multi-cluster warehouses with a higher MAX_CLUSTERS value and use the Standard scaling policy. This policy starts new clusters immediately when queries begin to queue, ensuring faster processing. Avoid the Economy scaling policy for essential tasks, as it prioritizes saving credits over performance, which can result in delays. Additionally, lowering the MAX_CONCURRENCY_LEVEL for warehouses handling complex queries can allocate more resources to each query, though this may increase queuing for other tasks.
To maintain availability during peak usage, assign critical warehouses to Resource Monitors with sufficient credit quotas. Set the monitors to "Notify" instead of "Suspend" to avoid unexpected disruptions when nearing credit limits. This ensures that high-priority workloads continue running without interruption.
| Feature | Impact on Priority | Recommended Setting |
|---|---|---|
| Warehouse Isolation | Prevents resource competition between tasks | Use dedicated warehouses for key workloads |
| Scaling Policy | Determines when extra clusters are added | Use Standard for immediate scaling |
| MAX_CONCURRENCY_LEVEL | Allocates resources to fewer queries at a time | Lower for complex, resource-intensive queries |
| Resource Monitors | Prevents warehouse suspension | Use "Notify" for critical warehouses |
sbb-itb-61a6e59
How to Use Clustering Keys and Micro-Partition Pruning
Using Clustering Keys to Speed Up Queries
Snowflake organizes data into micro-partitions, each ranging from 50 to 500 MB in size. While data naturally clusters during loading, setting a clustering key explicitly groups related data, allowing Snowflake to bypass irrelevant partitions during filtering or sorting. This reduces the amount of data scanned and improves query performance, especially under high concurrency.
"Clustering is generally most cost-effective for tables that are queried frequently and do not change frequently." - Snowflake Documentation
To make the most of clustering keys, stick to three or four columns, prioritizing those frequently used in selective filters (e.g., date columns in fact tables). Arrange these columns from lowest to highest cardinality. For columns with high cardinality, like nanosecond timestamps, you can simplify the data by applying an expression such as TO_DATE(timestamp_col). This reduces distinct values and enhances data grouping. To keep tabs on clustering efficiency, use the SYSTEM$CLUSTERING_INFORMATION function - a lower average depth indicates better pruning.
This setup lays the groundwork for efficient micro-partition pruning, which further refines query performance.
How Micro-Partition Pruning Works
When combined with clustering, micro-partition pruning takes query optimization a step further by skipping over partitions that don't match the query's filters. Each micro-partition includes metadata for every column - such as value ranges and distinct counts - that Snowflake uses to identify and exclude irrelevant partitions. Thanks to columnar storage, only the columns referenced in the query are scanned. For example, if a query filter targets 10% of a value range, only around 10% of the partitions will be scanned. This method is especially powerful for time-series data, enabling rapid responses even when querying specific time intervals across extensive historical datasets.
Once a clustering key is defined, Snowflake's Automatic Clustering service reorganizes data in the background without disrupting data manipulation operations (DML). To keep maintenance costs low, it’s best to batch INSERT, UPDATE, and DELETE operations into larger, less frequent batches. This reduces the frequency of automatic reclustering while maintaining high query performance, even under heavy workloads.
How to Monitor and Profile Concurrent Queries
How to Use Query History and Execution Plans
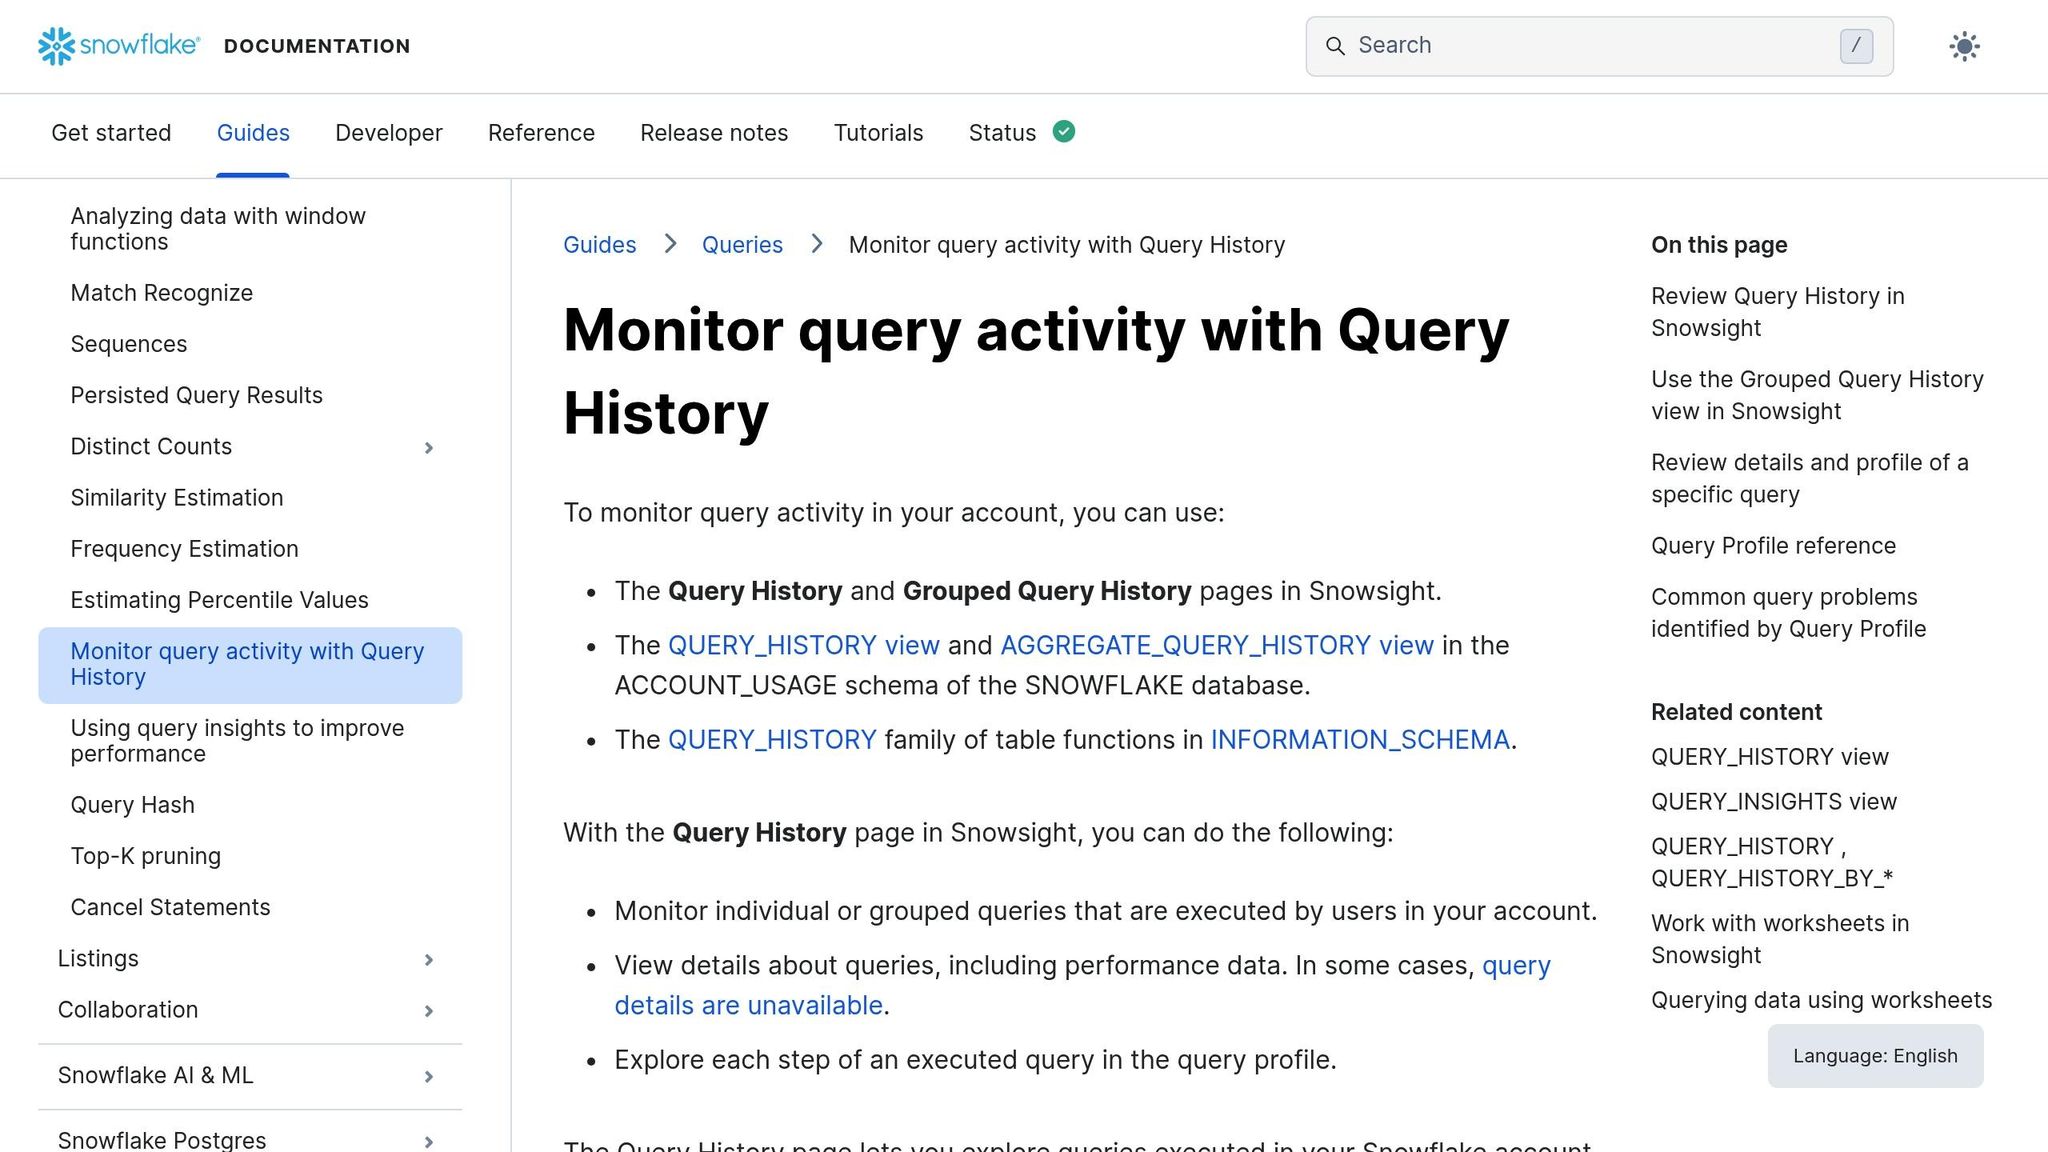
Monitoring query performance is a key step in managing concurrency effectively.
Snowsight's Query History feature logs query details for 14 days, including status, duration, warehouse size, and bytes scanned. To identify potential bottlenecks, you can filter queries by Status to focus on those marked as "Queued" (indicating they are waiting for warehouse resources) or "Blocked" (indicating a transaction lock). For workloads with high query volumes, the Grouped Query History view is particularly useful. It groups queries by their parameterized hash ID, making it easier to pinpoint repeated query types that may be overloading resources or causing queuing issues.
When you select a specific query, its Query Profile provides detailed insights. This includes a visualization of the execution plan, highlighting costly operator nodes. It also breaks down execution time into categories like Processing, Synchronization, and Throttling, and flags issues such as "Bytes spilled", which suggests memory overflow. Snowflake's automated Query Insights further assist by identifying problems like extended queuing or remote spillage and offering suggestions for improvement.
| Query Status | Description |
|---|---|
| Running | Queries actively processing during the interval |
| Queued | Queries waiting for resources due to warehouse overload |
| Queued (Provisioning) | Queries waiting while the warehouse is starting up or resuming |
| Blocked | Queries waiting due to a transaction lock |
For a more extensive historical view, you can query the ACCOUNT_USAGE.QUERY_HISTORY view, which stores up to 365 days of data, though it updates with a delay of up to 45 minutes. By using fields like query_hash or query_parameterized_hash, you can identify patterns in repeated, resource-intensive queries and optimize them to free up concurrency slots.
These tools enable proactive monitoring and help manage costs by identifying and addressing inefficiencies.
How to Set Up Resource Monitors
Resource monitors are essential for tracking credit usage and managing costs. They allow you to set thresholds and trigger actions when those thresholds are reached. These monitors can be configured at either the Account level (covering all warehouses) or the Warehouse level (specific to individual warehouses). However, a warehouse can only be assigned to one monitor at a time. By default, only users with the ACCOUNTADMIN role can create resource monitors, though they can delegate MONITOR or MODIFY privileges to other roles.
Triggers can be set up to take specific actions at defined quota percentages. For example:
- Set
NOTIFYat 50% and 75% to receive warnings. - Use
SUSPENDat 100% to block new queries while letting current ones finish. - Opt for
SUSPEND_IMMEDIATEto halt all running queries instantly.
To stay informed, enable notifications in Snowsight, as these are turned off by default. It’s also a good idea to set thresholds slightly below 100% (e.g., 90%) to ensure timely suspension of warehouses.
Resource monitors reset their credit tracking at 12:00 AM UTC daily, regardless of the configured start time. For workloads with high concurrency, assign a single warehouse to each monitor instead of grouping them. This ensures tighter cost control. Keep in mind that while resource monitors track both warehouse compute and cloud services, they cannot suspend serverless features like Snowpipe or automatic reclustering. For those, you’ll need to manage costs using Budgets.
Advanced Methods: Query Acceleration and Materialized Views
Building on earlier strategies, these advanced techniques focus on reducing compute demand while speeding up query results.
How to Use Result Caching for Query Acceleration
Snowflake's result caching is a powerful tool that stores query results and delivers them instantly when the same query is run again - without using your warehouse at all. This means no compute credits are spent on cached queries, freeing up your warehouse for other tasks.
Result caching works across your entire account. Even if a warehouse is suspended, the cached results remain accessible. Each time a cached query is used, the retention period resets, allowing results to stay available for up to 31 days from the original execution. For larger queries, security tokens expire after 6 hours, but you can retrieve a new token if the result is still cached.
To make the most of result caching, ensure your SQL syntax is consistent. The query must match exactly, including capitalization, table aliases, and even spacing. Avoid using non-deterministic functions like RANDOM(), UUID_STRING(), or CURRENT_TIMESTAMP() in queries where caching is important, as these functions prevent result reuse. For further processing, use the RESULT_SCAN table function to work with cached results instead of re-running the full query.
| Feature | Result Cache | Warehouse Cache |
|---|---|---|
| Storage Location | Global (Snowflake Managed) | Local (Virtual Warehouse SSD) |
| Persistence | 24 hours (up to 31 days) | Dropped when warehouse is suspended |
| Compute Cost | No credits used for retrieval | Requires running warehouse (credits) |
| Primary Benefit | Bypasses execution entirely | Speeds up data scanning from disk |
How to Use Materialized Views
Materialized views are another way to streamline query performance, especially for workloads with repetitive query patterns. A materialized view is essentially a pre-computed dataset stored as a database object, allowing you to retrieve results much faster than querying large base tables. Snowflake’s query optimizer can even rewrite queries to use a materialized view automatically, saving compute resources during periods of high demand.
"Materialized views are designed to improve query performance for workloads composed of common, repeated query patterns."
- Snowflake Documentation
These views are particularly effective when query results involve fewer rows or columns than the base table or include resource-intensive operations like aggregations or analyzing semi-structured data. Snowflake keeps materialized views up-to-date through a background service that updates the view whenever the base table changes. If a query arrives while the view is being updated, Snowflake combines the pre-computed data with fresh updates from the base table to ensure accurate results.
However, materialized views aren't always the right choice. If the base table changes frequently but the view is rarely queried, maintenance costs can outweigh the benefits. Carefully evaluate whether the performance gains justify the added storage and maintenance expenses. Keep in mind that materialized views are only available with Snowflake Enterprise Edition or higher and come with some limitations: they can only query a single table and don’t support joins, window functions, or non-deterministic functions.
Conclusion
Balancing query concurrency in Snowflake requires thoughtful management of compute resources, workload types, and cost considerations. Start by monitoring warehouse activity in Snowsight to identify queuing patterns. From there, decide whether to scale out with multi-cluster warehouses for handling high concurrency or scale up to improve performance for complex queries.
Queuing patterns often point to misaligned workload distribution. To address this, assign similar workloads to dedicated warehouses. Mixing queries with vastly different complexities can make it challenging to configure the right warehouse size and concurrency settings. For larger accounts, dedicating an X‑Small warehouse for Snowsight UI tasks can help. This approach minimizes interference from internal metadata queries, ensuring they don’t compete with production workloads.
Fine-tune auto-suspend settings based on workload behavior. For BI and SELECT-heavy use cases, set auto-suspend to at least 10 minutes to retain the warehouse cache. For ad-hoc tasks like DevOps or Data Science, a 5-minute setting works better since caching offers fewer benefits in these scenarios. Keep in mind that Snowflake charges for a minimum of 60 seconds each time a warehouse starts, so frequent suspensions can lead to wasted credits.
The default MAX_CONCURRENCY_LEVEL of 8 is suitable for many cases, but reducing it can improve performance for complex queries by allocating more resources per query. Test changes by re-running queries and analyzing performance metrics. For large scans involving selective filters, consider using Query Acceleration to offload processing without needing to increase warehouse size.
For multi-cluster setups, the Economy scaling policy is a cost-efficient option. It prioritizes fully utilizing existing clusters before spinning up new ones, making it ideal when cost management takes precedence over immediate query execution. Regularly track metrics like "Query Overload %" and "Query Blocked %." Keeping these near zero ensures minimal wait times for users and smooth query execution.
FAQs
What is MAX_CONCURRENCY_LEVEL, and how does it improve query performance in Snowflake?
The MAX_CONCURRENCY_LEVEL setting determines how many queries can run at the same time on a Snowflake warehouse. By capping concurrency, it helps minimize resource competition, ensuring that each query gets more system resources. This approach can boost performance, especially for large or complex queries, as they benefit from having more compute power and fewer bottlenecks.
Tweaking this setting is especially handy when you're handling workloads with resource-heavy queries or need to prioritize specific tasks. It allows you to balance throughput and performance, making the most of your Snowflake setup.
What are the advantages of using auto-scaling for warehouses in Snowflake?
Snowflake's auto-scaling feature is designed to handle workloads efficiently by dynamically adjusting compute resources based on demand. When query traffic spikes, auto-scaling ensures your system can handle the increased load without slowing down. This means even during peak usage, your queries run smoothly.
Another major advantage is cost optimization. Snowflake automatically pauses warehouses when they're idle and resizes them as needed. This way, you're only charged for the resources you actively use, helping you manage expenses more effectively.
What sets Snowflake apart is its separation of compute and storage. This design keeps your system agile and responsive, even when workloads are heavy. It's a great fit for businesses that need to scale up or down without sacrificing performance or overspending.
How do clustering keys improve query performance in Snowflake?
Clustering keys enhance query performance in Snowflake by structuring data within its micro-partitions, streamlining the process of finding and retrieving relevant information. This technique, called micro-partition pruning, helps Snowflake avoid scanning irrelevant data, which cuts down on query execution time.
To get the most out of clustering keys, choose them based on the columns most often used for filtering or sorting. This targeted approach can significantly boost performance and conserve resources - especially when working with massive datasets where quick and efficient data access is essential.