5 Steps to Automate Data Profiling in Snowflake
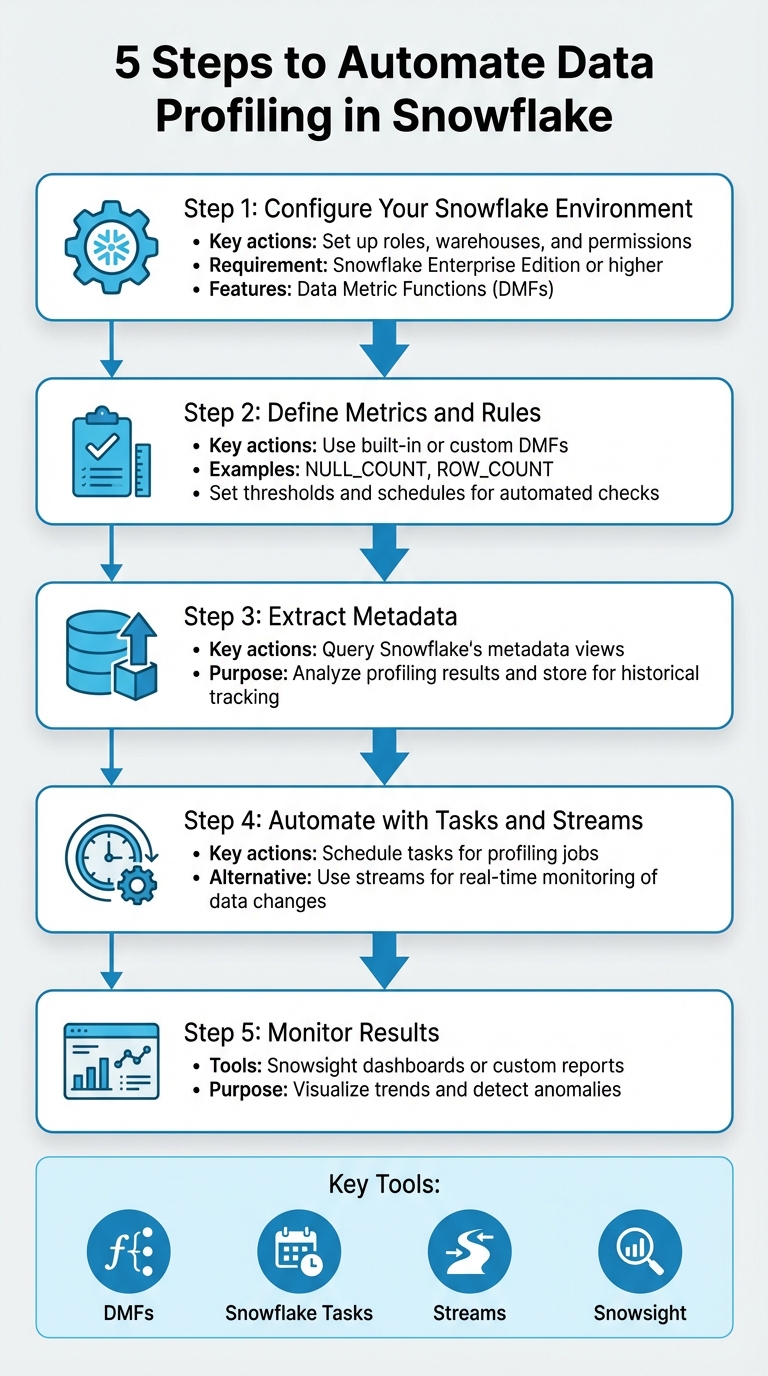
Automating data profiling in Snowflake ensures consistent data quality checks at scale, saving time and reducing errors. Here's how you can set it up in five steps:
- Configure Your Snowflake Environment: Set up roles, warehouses, and permissions. Use Snowflake Enterprise Edition or higher to access automation features like Data Metric Functions (DMFs).
- Define Metrics and Rules: Use built-in or custom DMFs to track data quality, such as
NULL_COUNTorROW_COUNT. Set thresholds and schedules for automated checks. - Extract Metadata: Query Snowflake's metadata views to analyze profiling results and store them for historical tracking.
- Automate with Tasks and Streams: Schedule tasks to run profiling jobs or use streams for real-time monitoring of data changes.
- Monitor Results: Use Snowflake's Snowsight dashboards or create custom reports to visualize trends and detect anomalies.
Key Tools: DMFs, Snowflake Tasks, Streams, and Snowsight.
Pro Tip: Focus on critical tables and use anomaly detection to flag unexpected issues. Monitor serverless compute costs to stay efficient.
This process helps maintain reliable data pipelines and prevents errors from propagating across systems. Let’s dive into the details.
5-Step Process to Automate Data Profiling in Snowflake
❄️ Automate Data Quality Checks in Snowflake | Schedule & Trigger Data Metric Functions
Prerequisites for Snowflake Data Profiling Automation
To get started with automating data profiling in Snowflake, you’ll need to ensure you have the correct account setup, permissions, and a solid understanding of Snowflake’s features. Keep in mind that not all Snowflake accounts support automated profiling, so you’ll need to confirm you’re using a fully licensed edition.
Snowflake Account Setup and Permissions
Automation for data profiling is only available with Snowflake Enterprise Edition or higher. If you’re using trial or reader accounts, this feature won’t be accessible.
To associate Data Metric Functions (DMFs) with tables or views, you’ll need the EXECUTE DATA METRIC FUNCTION privilege at the account level. For creating custom DMFs, the CREATE DATA METRIC FUNCTION privilege is required on the relevant schema. Additionally, you must have OWNERSHIP of the target table, or if you only have SELECT privileges, you’ll need to enable the EXECUTE AS ROLE property to proceed.
Snowflake also uses specific roles for managing data quality. To work with DMFs, you’ll need the SNOWFLAKE.DATA_METRIC_USER role. Viewing profiling results on the monitoring dashboard requires either the SNOWFLAKE.DATA_QUALITY_MONITORING_VIEWER role or an ADMIN role. If you plan to use AI-driven Cortex suggestions for quality checks, the SNOWFLAKE.CORTEX_USER role is also necessary.
| Task | Required Privilege/Role | Scope |
|---|---|---|
| Associate DMF with Table | EXECUTE DATA METRIC FUNCTION |
Account |
| Create Custom DMF | CREATE DATA METRIC FUNCTION |
Schema |
| Use DMFs | SNOWFLAKE.DATA_METRIC_USER |
Database Role |
| View Results | SNOWFLAKE.DATA_QUALITY_MONITORING_VIEWER |
Application Role |
| AI Suggestions | SNOWFLAKE.CORTEX_USER |
Database Role |
Start by using the ACCOUNTADMIN role to create a dedicated functional role, such as data_quality_admin, and assign the necessary privileges. This setup will allow you to delegate tasks to technical teams effectively. For warehouse configuration, an X-Small warehouse typically handles background profiling queries well, but larger datasets might require more compute power. Finally, ensure you’re equipped with the right technical skills and tools—perhaps by comparing data engineering bootcamps—to make full use of these permissions.
Technical Skills and Tools
A strong understanding of SQL is essential, particularly commands like ALTER TABLE and ALTER VIEW. You’ll also need to grasp Snowflake’s serverless execution model, as it directly impacts how profiling tasks consume resources and accumulate costs.
Snowflake provides several tools for automation, including:
- DMFs: Useful for metrics like
NULL_COUNTandROW_COUNT. - Tasks: For scheduling automated profiling jobs.
- Streams: For tracking changes over time.
For initial profiling and monitoring, the Snowsight UI is a great starting point. Use the Data Quality tab to view results, and for more advanced checks, Snowflake Scripting is a powerful option.
Be aware of system constraints when planning your automation. Snowflake limits accounts to 10,000 DMF associations. Additionally, the minimum scheduling interval is 5 minutes, and any changes to DMF schedules take 10 minutes to take effect. These limitations should be factored into your overall strategy.
Step 1: Set Up Your Snowflake Environment and Run Initial Profiling
Creating Snowflake Objects
To get started with data profiling in Snowflake, you'll need to create specific objects within your environment. Using the ACCOUNTADMIN role, set up a dedicated role, warehouse, database, and schema. This ensures your profiling tasks remain organized and isolated.
Here's a quick breakdown of the SQL commands you'll need:
| Object Type | SQL Command Example |
|---|---|
| Role | CREATE ROLE IF NOT EXISTS dq_tutorial_role; |
| Warehouse | CREATE WAREHOUSE IF NOT EXISTS dq_tutorial_wh WITH WAREHOUSE_SIZE = 'XSMALL'; |
| Database | CREATE DATABASE IF NOT EXISTS dq_tutorial_db; |
| Schema | CREATE SCHEMA IF NOT EXISTS dq_tutorial_db.sch; |
| Privileges | GRANT EXECUTE DATA METRIC FUNCTION ON ACCOUNT TO ROLE dq_tutorial_role; |
| Database Role | GRANT DATABASE ROLE SNOWFLAKE.DATA_METRIC_USER TO ROLE dq_tutorial_role; |
For efficiency, use an X-Small warehouse - it balances performance with minimal credit consumption. After setting up the warehouse, ensure your profiling role has the necessary privileges, such as USAGE on the warehouse, database, and schema, along with SELECT or OWNERSHIP on the tables you plan to profile.
To confirm everything is configured correctly, run the following command:
SHOW GRANTS TO ROLE dq_tutorial_role;
This will display all privileges granted to the role. Additionally, assign your custom role to SYSADMIN to maintain proper role hierarchy and ensure visibility across your team.
Once everything is in place, you're ready to move on to data quality verification using Snowsight.
Running Initial Profiling in Snowsight
Start your profiling by running a manual check in Snowsight. Navigate to Catalog » Database Explorer, choose the table you want to profile, and select Data Profile under the Data Quality tab. Make sure your X-Small warehouse is active before you begin, as profiling will consume credits from the selected warehouse.
Snowflake's profiling feature automatically gathers key statistics, helping you uncover potential quality issues. These might include unexpected duplicates, null values, date gaps, or mismatched data types. The insights from this initial profiling step will guide you in prioritizing metrics for your automation plans.
You can profile a variety of objects, including standard tables, views, materialized views, dynamic tables, event tables, external tables, and Iceberg tables. However, hybrid tables and stream objects are not supported.
Step 2: Define Profiling Metrics and Rules with Data Metric Functions
Creating Custom Data Metric Functions
Once the initial profiling is complete, the next step is to set up custom metrics that align with your organization's specific needs. Snowflake's Data Metric Functions (DMFs) are tools designed to measure data quality attributes. While Snowflake provides built-in system DMFs like NULL_COUNT and ROW_COUNT, creating custom DMFs allows you to enforce rules that are uniquely relevant to your business goals.
To create a custom DMF, use the CREATE DATA METRIC FUNCTION command. Each DMF must accept at least one TABLE argument and return a scalar NUMBER value. Currently, SQL is the only supported language for writing these functions. It's important to ensure that your DMFs are deterministic, meaning they should avoid using non-deterministic functions like CURRENT_TIMESTAMP. Instead, use SNOWFLAKE.CORE.DATA_METRIC_SCHEDULED_TIME() for time-based logic.
When working with complex regex patterns, apply dollar-quoting to avoid issues with single quotes. Since DMFs don't support polymorphic types like VARIANT, it's helpful to add suffixes like _V (for VARCHAR) or _N (for NUMBER) to function names, making it clear which version is meant for specific column types.
Here are a few examples of SQL logic you might use for custom metrics:
| Metric Type | SQL Logic Example |
|---|---|
| Null Rate (%) | SELECT ROUND(100.0 * COUNT_IF(arg_c IS NULL) / NULLIF(COUNT(*), 0), 2) FROM arg_t |
| Duplicate Count | SELECT COUNT(*) - COUNT(DISTINCT arg_c) FROM arg_t |
| Mean Value | SELECT AVG(arg_c) FROM arg_t |
| Regex Validation | COUNT rows where arg_c does not match the pattern |
Before automating these functions, test them using a SELECT statement like SELECT my_dmf(SELECT col FROM my_table) to confirm their accuracy. This step helps you identify and fix potential issues before the functions are tied to automated processes.
Once your custom DMFs are validated, you can link them to tables by defining data quality Expectations.
Setting Data Quality Expectations
With your DMFs in place, the next step is to establish explicit data quality rules. These rules ensure consistent monitoring and help maintain high data standards. You can associate DMFs with specific columns and define clear thresholds using the ALTER TABLE ... ADD DATA METRIC FUNCTION ... ON (<columns>) command.
For example, an Expectation like Expectation Null_Check (value = 0) ensures that a column contains no null values. Similarly, thresholds such as value < 100 can be applied to metrics that track anomalies or outliers. To control when these checks are performed, configure the DATA_METRIC_SCHEDULE parameter. Options include setting specific intervals (e.g., '5 MINUTE'), using CRON expressions, or opting for TRIGGER_ON_CHANGES, which executes checks only when data is modified.
"Data quality is the third, equally important dimension for data engineers to monitor and get notified at certain thresholds just like for failures and delays." - Jan Sommerfeld, Product @ Snowflake
Before diving into custom coding, explore the SNOWFLAKE.CORE schema for pre-built metrics like FRESHNESS, DUPLICATE_COUNT, and ACCEPTED_VALUES. Using these pre-built options can save time and reduce the need for ongoing maintenance. For tables with irregular updates, consider using TRIGGER_ON_CHANGES instead of frequent CRON schedules. This approach minimizes serverless compute usage by running checks only when necessary.
Keep in mind that Data Quality Monitoring is available only with Enterprise Edition or higher. Additionally, automated DMF execution consumes serverless compute resources, which you can track through the DATA_QUALITY_MONITORING_USAGE_HISTORY view.
Step 3: Extract and Store Profiling Metadata
Querying Snowflake Metadata
Once you've defined your custom metrics and expectations in Step 2, the next step is to extract profiling metadata for deeper analysis and historical tracking. Snowflake offers three main methods for accessing this metadata via SQL: querying the raw event table, using a flattened system view, or calling a specific table function.
For most analyses, the SNOWFLAKE.LOCAL.DATA_QUALITY_MONITORING_RESULTS view is the best starting point. This view simplifies queries by flattening raw data from the event table. If you need object-specific details, the DATA_QUALITY_MONITORING_RESULTS table function is ideal, as it provides a row for each Data Metric Function (DMF) assigned to a table or view.
When extracting results, rely on the measurement_time column instead of scheduled_time to ensure you're capturing the actual evaluation timestamp, which is crucial for accurate historical tracking.
To verify which profiling metrics are linked to your tables, you can query the INFORMATION_SCHEMA.DATA_METRIC_FUNCTION_REFERENCES view or use the SHOW DATA METRIC FUNCTIONS command. This allows you to confirm that critical tables have necessary metrics like NULL_COUNT or UNIQUE_COUNT correctly configured.
| Object Name | Type | Description |
|---|---|---|
SNOWFLAKE.LOCAL.DATA_QUALITY_MONITORING_RESULTS_RAW |
Event Table | Contains raw, unformatted data from all DMF evaluations |
SNOWFLAKE.LOCAL.DATA_QUALITY_MONITORING_RESULTS |
View | A flattened view for easier analysis |
DATA_QUALITY_MONITORING_RESULTS() |
Table Function | Provides evaluation results for a specific table or view |
DATA_METRIC_FUNCTION_REFERENCES |
View/Function | Identifies links between DMFs and tables/views |
With the profiling metadata in hand, the next step is to store these results for long-term use.
Storing Profiling Results
To retain profiling results beyond Snowflake's default limits, create a custom table and schedule tasks to regularly INSERT INTO this table by pulling data from the DATA_QUALITY_MONITORING_RESULTS view. This gives you full control over how long data is stored and enables trend analysis over extended periods.
Set up a dedicated schema or table with a timestamp column (using the measurement_time field from the system view) for each profiling entry. This structure makes it easy to track trends and distributions over time. Focus on storing metadata for tables that are critical to dashboards, reports, or customer-facing interfaces.
Adopting a hybrid monitoring strategy is highly effective. Capture metadata at the Bronze (ingestion), Silver (transformation), and Gold (business logic) layers to maintain visibility across the entire data pipeline. At each layer, track essential metrics like row_count, null_count, duplicate_count, as well as statistical measures such as mean and std_deviation.
It's important to note that querying these metadata views requires specific privileges. For instance, the SNOWFLAKE.GOVERNANCE_VIEWER role does not have default access to the DATA_QUALITY_MONITORING_RESULTS view. Additionally, Snowflake accounts are limited to 10,000 total DMF associations across objects, so plan your profiling strategy carefully to stay within these limits.
sbb-itb-61a6e59
Step 4: Automate Profiling with Snowflake Tasks and Streams
Creating and Scheduling Snowflake Tasks
Once your profiling metadata storage is set up, the next step is automating the extraction process. This is where Snowflake Tasks come into play. A task in Snowflake is essentially a database object designed to execute a single SQL statement or stored procedure. It can run on a defined schedule or be triggered by specific conditions, like the availability of new data.
The simplest way to get started is by setting up a scheduled task. For instance, you can configure it to execute every 5 minutes. To do this, use the SCHEDULE parameter to define the timing. For cost efficiency, an X-Small warehouse is an excellent choice, balancing performance and minimal credit usage.
Here’s an example:
CREATE OR REPLACE TASK profile_metadata_task
  WAREHOUSE = profiling_wh
  SCHEDULE = '5 MINUTE'
AS
  INSERT INTO my_schema.profiling_history
  SELECT measurement_time, table_name, metric_name, value
  FROM SNOWFLAKE.LOCAL.DATA_QUALITY_MONITORING_RESULTS
  WHERE measurement_time > DATEADD(MINUTE, -5, CURRENT_TIMESTAMP());
Keep in mind that tasks are created in a SUSPENDED state by default. You’ll need to explicitly enable them using the ALTER TASK ... RESUME command. To track task executions, you can check the TASK_HISTORY view found in either the INFORMATION_SCHEMA or ACCOUNT_USAGE schemas.
For more advanced workflows, like chaining multiple tasks for data landing, transformation, and profiling, you can create task graphs (DAGs). Use the AFTER keyword to ensure tasks execute in the right order.
While scheduled tasks are great for processing data at regular intervals, streams are a better fit for tracking incremental changes.
Using Streams for Change Tracking
For real-time monitoring and reduced resource usage, you can pair streams with triggered tasks. A stream captures all DML changes (inserts, updates, deletes) made to a table or view, enabling incremental profiling without scanning the entire dataset.
Before setting up a stream, ensure change tracking is enabled on the table:
ALTER TABLE my_table SET CHANGE_TRACKING = TRUE;
Next, create a stream to monitor the table’s changes:
CREATE OR REPLACE STREAM my_data_stream ON TABLE my_table;
By combining streams with triggered tasks, you can perform continuous profiling. Unlike scheduled tasks, triggered tasks run only when the associated stream contains new data. Use the WHEN SYSTEM$STREAM_HAS_DATA('stream_name') clause to set this up:
CREATE OR REPLACE TASK incremental_profile_task
  WAREHOUSE = profiling_wh
  WHEN SYSTEM$STREAM_HAS_DATA('my_data_stream')
AS
  INSERT INTO profiling_results
  SELECT COUNT(*), AVG(column_name), measurement_time
  FROM my_data_stream;
"Combining tasks with table streams is a convenient and powerful way to continuously process new or changed data."
– Snowflake Documentation
Triggered tasks typically run every 30 seconds by default. However, you can lower this interval to 10 seconds by adjusting the USER_TASK_MINIMUM_TRIGGER_INTERVAL_IN_SECONDS parameter. In December 2025, Steven Maser from Snowflake showcased a pipeline processing 1 million simulated credit card transactions per minute. The system achieved "exactly once" semantics for 15,000 transactions per second using an X-Small warehouse and serverless compute options.
A quick note: querying a stream doesn’t consume its data, but using it in a DML transaction (like INSERT or MERGE) does. If multiple tasks need to process the same data changes, create separate streams for each task. Additionally, if a triggered task remains inactive for 12 hours, Snowflake automatically schedules a health check to prevent the stream from becoming stale.
| Feature | Scheduled Task | Triggered Task |
|---|---|---|
| Trigger Mechanism | Time-based (Interval/CRON) | Data-based (Stream availability) |
| SQL Clause | SCHEDULE = '5 MINUTE' |
WHEN SYSTEM$STREAM_HAS_DATA() |
| Compute Usage | Runs at scheduled intervals | Runs only when new data is detected |
| Latency | Depends on schedule | Low; processes data immediately |
| Primary Use Case | Full-table profiling | Incremental profiling |
For more complex workflows, consider serverless tasks. These eliminate the need to manage virtual warehouses by dynamically scaling compute resources based on your TARGET_COMPLETION_INTERVAL setting. This ensures efficient profiling without manually provisioning capacity.
Step 5: Monitor and Visualize Automated Profiling Results
Now that your automated profiling is set up, it's time to focus on monitoring and visualizing the results to ensure data quality stays on track.
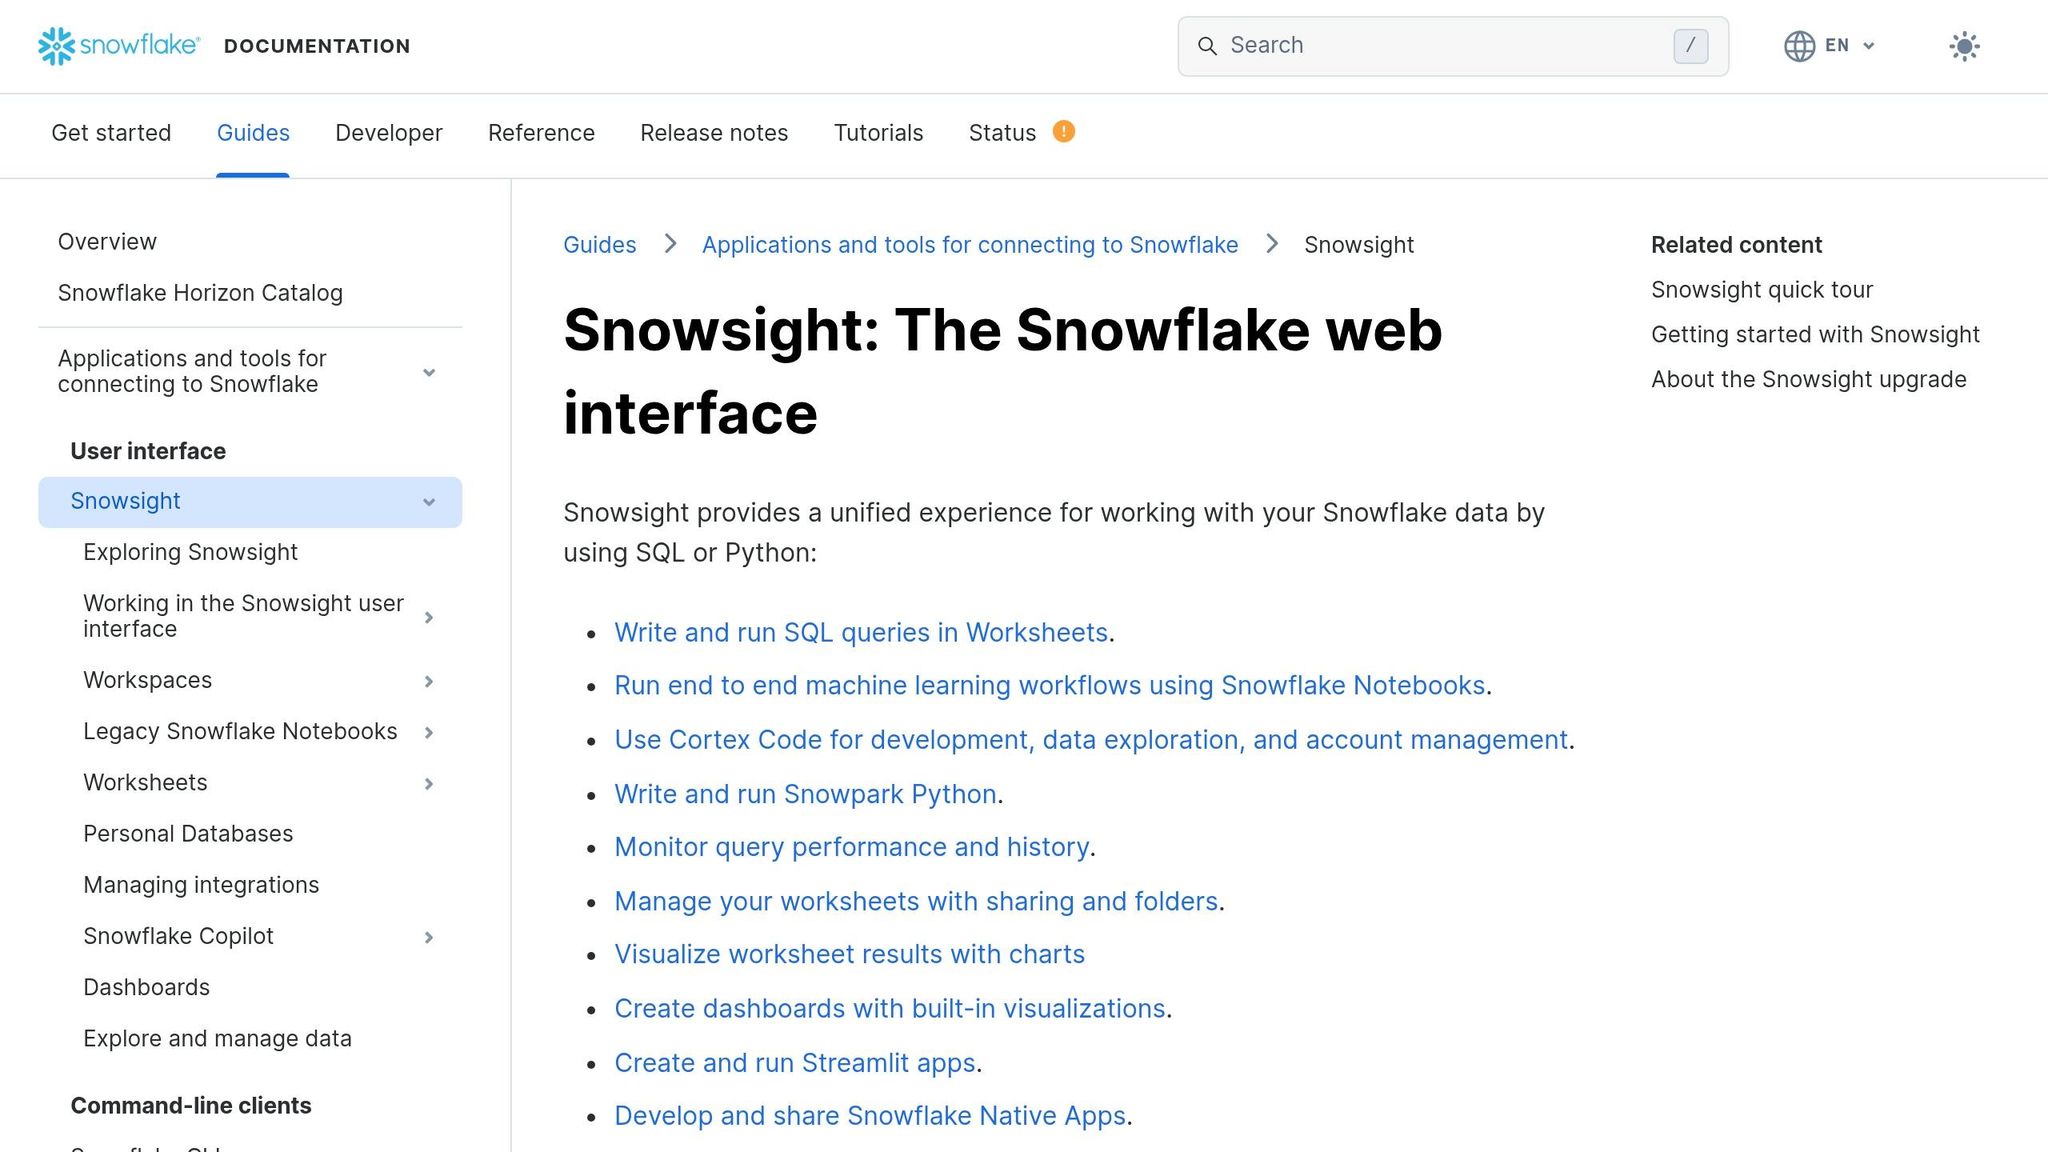
Using Snowflake Monitoring Dashboards
Snowflake's Data Quality tab in Snowsight (accessible under Catalog » Database Explorer) provides an interactive way to monitor your Data Metric Functions (DMFs). The Monitoring sub-tab offers a seven-day trend view for each DMF, with red-coded widgets that instantly highlight failures in categories like Accuracy, Volume, and Custom metrics. Clicking on a failed check pulls up a Run History graph in the side panel, helping you identify whether the issue is isolated or part of a recurring pattern.
For tables using system DMFs like ROW_COUNT and FRESHNESS, you can enable anomaly detection. This feature analyzes historical data to predict expected ranges and flags values that deviate from those ranges. To establish accurate weekly patterns, Snowflake recommends at least 60 days of DMF data, though the minimum requirement is two weeks. If you experience too many false positives, adjust the sensitivity with SET SENSITIVITY = 'LOW', or set it to 'HIGH' if critical issues are slipping through.
When a check fails, you can pinpoint the problematic rows by clicking View Failed Records. This action runs the SYSTEM$DATA_METRIC_SCAN function, which also highlights any downstream assets impacted by the issue.
Keep in mind that these features require an Enterprise Edition account or higher. DMF executions use serverless compute resources, which are billed under "Data Quality Monitoring" on your monthly statement. To monitor these costs, query the DATA_QUALITY_MONITORING_USAGE_HISTORY view.
For teams needing more specific insights, you can create custom dashboards to complement the built-in tools. You can also explore our latest blog posts for more advanced data engineering techniques.
Building Custom Dashboards for Insights
Custom dashboards allow for deeper analysis tailored to your team's needs. Start by querying the SNOWFLAKE.LOCAL.DATA_QUALITY_MONITORING_RESULTS view, which stores scheduled DMF run results. Use filters like METRIC_NAME and TABLE_NAME to focus on the most relevant profiling statistics.
To ensure results appear in monitoring views, schedule your DMFs by setting the DATA_METRIC_SCHEDULE parameter. Options include TRIGGER_ON_CHANGES for real-time monitoring or a CRON schedule for regular profiling. Note that manually running a DMF using a SELECT statement will not log results to these views.
For tracking costs, query the SNOWFLAKE.ACCOUNT_USAGE.DATA_QUALITY_MONITORING_USAGE_HISTORY view. This view provides details on serverless credit consumption, though data typically has a 1–2 hour latency before appearing. You can use this data to create dashboard tiles that display metrics over time and include drill-down capabilities with the SYSTEM$DATA_METRIC_SCAN function to review failing records in detail.
To access the profiling results and create dashboards, your role must have the SNOWFLAKE.DATA_QUALITY_MONITORING_VIEWER application role. Keep in mind that accounts are limited to 10,000 DMF associations.
| Feature | Built-in Snowsight Monitoring | Custom Snowsight Dashboards |
|---|---|---|
| Data Source | Pre-configured UI | DATA_QUALITY_MONITORING_RESULTS view |
| Trend Analysis | 7-day sparklines | User-defined time intervals (SQL-based) |
| Anomaly Detection | Volume and Freshness alerts | Custom thresholds and AI-driven metrics |
| Record Inspection | View Failed Records button |
SYSTEM$DATA_METRIC_SCAN query tiles |
| Cost Visibility | Not directly in the Quality tab | DATA_QUALITY_MONITORING_USAGE_HISTORY |
Best Practices for Automated Data Profiling
Once your automated data profiling is up and running, a few smart choices can make the difference between a tool that enhances data quality and one that turns into a maintenance headache.
Choosing Granularity for Profiling
The level of detail you choose for profiling should align with where your data is in the pipeline. For Bronze layers, focus on table-level metrics like row counts and freshness. These checks are great for spotting broad issues, such as missing files or delayed data loads. On the other hand, Silver and Gold layers need more detailed, column-level profiling. This approach helps validate business logic, catch unexpected spikes in null values, and ensure referential integrity across datasets.
"While each strategy has merit, the most effective approach is hybrid monitoring across all three layers [Bronze, Silver, Gold]."
– Snowflake Developer Guide
Keep in mind that profiling at a finer granularity increases compute costs. Scanning actual data values for column-level profiling uses more serverless credits than simpler, metadata-based table checks. To manage costs, reserve high-granularity profiling for critical fields - like personally identifiable information, financial data, or columns tied to executive dashboards - where accuracy and compliance are non-negotiable. Before deploying new profiling rules, test them on zero-copy clones to avoid impacting live workloads.
Once you've defined your profiling levels, the next step is integrating anomaly detection to further enhance your monitoring.
Integrating Anomaly Detection
Building on your chosen profiling granularity, Snowflake offers native anomaly detection tools that analyze historical Data Metric Functions (DMF) data to predict expected ranges for key metrics like ROW_COUNT and FRESHNESS. To activate this feature, include ANOMALY_DETECTION = TRUE when linking a DMF to a table using the ALTER TABLE command. The system flags any values that deviate from predicted ranges, relying on weekly or monthly seasonality patterns.
For effective anomaly detection, Snowflake requires two weeks of DMF data for weekly patterns and 60 days for monthly seasonality. If you encounter too many false alerts, you can lower the sensitivity by running SET SENSITIVITY = 'LOW'. Conversely, if critical issues are slipping through, increase sensitivity with SET SENSITIVITY = 'HIGH'. Start with mission-critical tables - those powering customer-facing features, financial reports, or executive dashboards - where silent failures can have serious consequences. To check on training progress, use the DATA_METRIC_FUNCTION_REFERENCES function to confirm whether the anomaly_detection_status is still marked as TRAINING_IN_PROGRESS.
Keep in mind that anomaly detection is available only with Snowflake's Enterprise Edition or higher, and it uses serverless compute resources billed under "Data Quality Monitoring".
Comparing Manual vs. Automated Profiling
Automated profiling clearly outpaces manual checks when it comes to scalability and proactive monitoring. While manual profiling might work for a handful of tables, it quickly becomes unmanageable at scale. Writing custom SQL for every check can turn into a full-time job for your engineering team. Plus, manual checks only provide a snapshot of your data's current state, making it harder to track historical trends or catch "silent failures" like schema drifts before they cause issues.
| Feature | Manual Profiling | Automated Profiling (DMFs/Tasks) |
|---|---|---|
| Effort | High; requires custom SQL for every check | Low; uses built-in DMFs and AI-suggested checks |
| Scalability & Alerting | Poor; hard to manage at scale, no built-in alerts | High; scales with serverless compute and includes alerts via Slack, email, or PagerDuty |
| Detection & History | Reactive; issues found after dashboards break, limited historical tracking | Proactive; detects anomalies and schema drift in real time using historical baselines |
"Schema changes... are the #1 cause of silent data pipeline failures, and neither Snowflake nor Databricks will warn you when they happen."
– AnomalyArmor
Automated profiling transforms data quality management from a reactive process to a proactive one. A great starting point is implementing schema change detection, which offers high value with minimal setup effort.
Conclusion
Automating data profiling in Snowflake transforms data quality management from a reactive process into a proactive one. This framework identifies issues early, ensures continuous validation of transformations, and protects downstream analytics from undetected errors.
With this approach, data engineers can spend less time on repetitive manual checks and more on high-value projects. Catching issues at the Bronze layer prevents flawed data from propagating through pipelines, saving time and reducing risks. Snowflake’s native features handle this seamlessly, securing metadata while eliminating the need for external tools. It’s an efficient way to manage data quality from start to finish.
"If you don't know your data, you can't trust your insights." – Dewank Mahajan, AI Mind
Start by applying system DMFs to critical tables - especially those powering executive dashboards or financial reports. Use Cortex Data Quality to recommend checks based on metadata patterns, and monitor credit usage with the DATA_QUALITY_MONITORING_USAGE_HISTORY view to maintain predictable costs. Regularly tracking credit consumption ensures that proactive data quality management stays cost-efficient. By adopting these strategies, you can build strong, reliable data pipelines that stand the test of time.
FAQs
How do I estimate DMF serverless costs before I automate profiling?
To calculate serverless costs tied to Data Metric Functions (DMFs) in Snowflake, you’ll need to focus on serverless compute usage. Snowflake provides monitoring tools, like Snowsight, to help track credit consumption effectively.
When managing costs, it’s important to consider the size of your warehouse. Smaller warehouses are more cost-efficient but might slow down performance. On the flip side, larger warehouses deliver better performance but consume more credits. The key is to regularly review your warehouse's credit usage and adjust its size to strike the right balance between performance and cost. Once you’ve fine-tuned this, you can move forward with automating data profiling.
Should I use a schedule or TRIGGER_ON_CHANGES for my profiling checks?
Setting up a schedule for data profiling checks in Snowflake is a smart move. It ensures regular monitoring by linking data metric functions (DMFs) to specific tables or views.
While the TRIGGER_ON_CHANGES feature is handy for alerts triggered by specific events, scheduled checks offer a more consistent and automated approach. This method aligns perfectly with Snowflake’s practices for maintaining reliable data quality over time.
What’s the best way to store and keep profiling history long-term?
To keep a record of profiling history in Snowflake, start by creating data profiles that capture key metrics such as distributions, null counts, and other relevant statistics over time. Save these profiles in dedicated tables or views, ensuring they include timestamp columns for tracking changes historically.
Set up automated profiling jobs using Snowflake’s built-in tools or external schedulers to periodically generate snapshots of your data. This approach allows for continuous monitoring, trend analysis, and identifying data drift over time. If needed, third-party tools can simplify and enhance this entire process.