
How Data Teams Drive Continuous Improvement
Data teams are more than just dashboard builders - they're the engine behind continuous improvement in organizations. By refining workflows, measuring outcomes, and collaborating across roles, these teams help businesses make smarter decisions, faster. Here's what you need to know:
- Why It Matters: Poor data quality costs companies $406M annually, and data breaches average $4.45M per incident. Treating data systems with the same care as software is critical.
- Key Roles: Engineers create reusable assets, analysts uncover insights, and decision-makers turn insights into strategies. Together, they can boost productivity by 20–30%.
- Steps to Improve:
- Review workflows and metrics to identify bottlenecks.
- Analyze root causes of errors using techniques like "5 Whys."
- Apply the PDCA cycle (Plan-Do-Check-Act) for iterative improvements.
- Set feedback loops and SMART goals to track progress.
- Use modern tools (e.g., Snowflake, dbt) and agile methods for efficiency.
- Monitor key metrics like data downtime and maintain improvements over time.
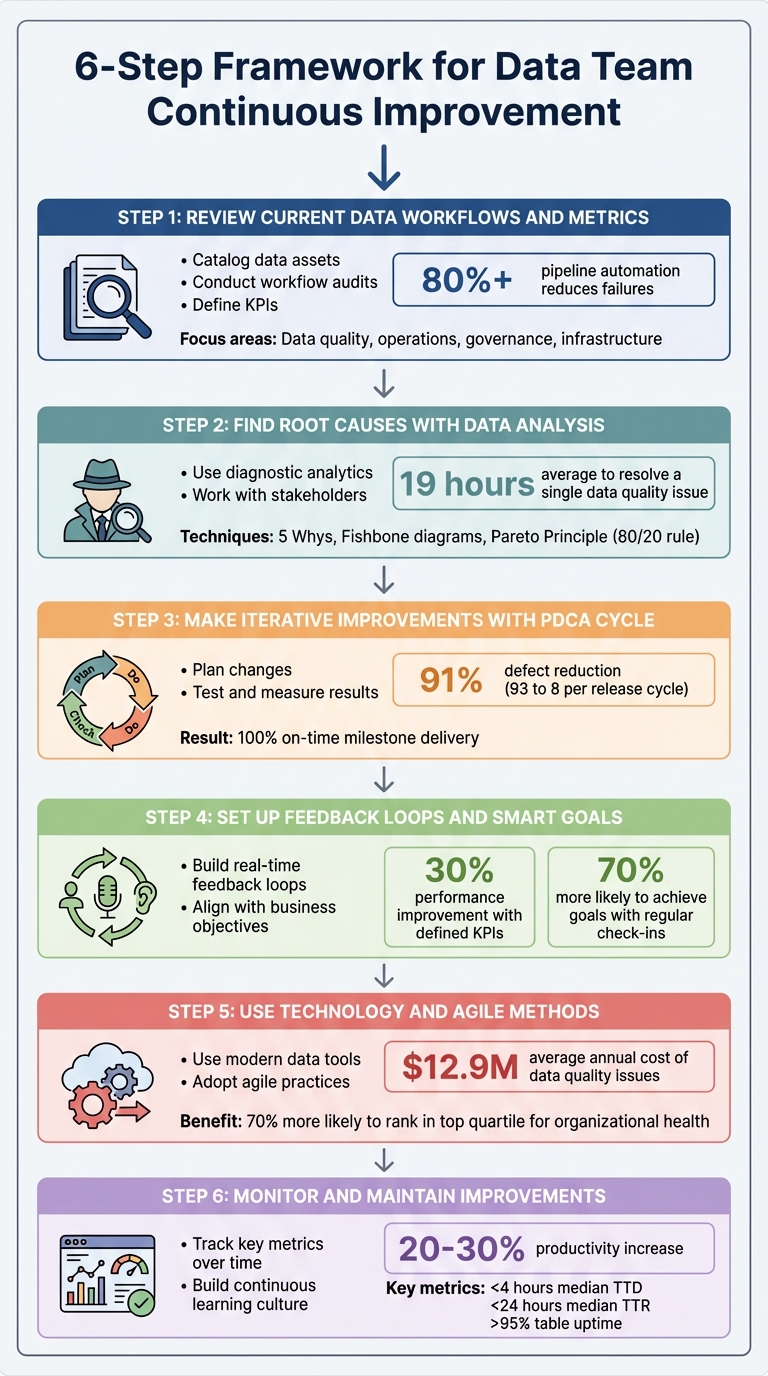
6-Step Framework for Data Team Continuous Improvement
Boost Efficiency: Data Quality & Continuous Improvement
sbb-itb-61a6e59
Step 1: Review Current Data Workflows and Metrics
Start by documenting your current data processes—a core skill for analytics excellence— - every pipeline, tool, and handoff involved. Without this foundation, it’s impossible to gauge progress.
Catalog your data assets. List all major data sources - like Salesforce, NetSuite, Google Ads, or internal databases - and map how they connect to dashboards or products. Prioritize based on their importance and the challenges they present. As Kira Furuichi from dbt Labs puts it:
"Data quality will never be 100% perfect... but, data teams can use data quality dimensions, paired with data tests, to work towards that perfection".
Your audit should focus on four main areas: data quality (freshness, accuracy, completeness), operations (job runtimes, failure rates, latency), governance (access controls, PII classification, lineage documentation), and infrastructure (version control, CI/CD pipelines, tool integrations). Leverage lineage tools to trace data flows from ingestion to consumption, uncovering hidden dependencies that could break during updates. This comprehensive baseline is key for driving future improvements.
Conduct Workflow Audits
Examine job runtimes and failure rates across the entire pipeline - from data ingestion to production outputs. Identify bottlenecks that slow things down.
For instance, in March 2025, a fintech company reviewed its real-time fraud detection pipeline. By analyzing Kafka consumer lag and implementing Datadog and Prometheus for monitoring, they set a 3-second latency limit and used OpenTelemetry for tracing. The result? A 40% reduction in fraud detection time, significantly lowering financial risks. Around the same time, an e-commerce company addressed schema changes that disrupted downstream systems. They automated schema validation in dbt and used Monte Carlo to monitor volume spikes, triggering alerts for changes exceeding 50% per hour. This approach reduced schema-related downtime by 90%.
Check whether your transformations adhere to the "DRY" (Don't Repeat Yourself) principle - reuse existing code whenever possible instead of creating new assets. Review role-based access controls, PII classifications, and compliance with regulations. Identify any "blind spots" where tools fail to integrate, leaving gaps in your visibility.
Once you have a clear view of your workflows, you can define KPIs that align with your business objectives.
Define Key Performance Indicators (KPIs)
Use the insights from your audit to set metrics that drive real improvements. Align these KPIs with your organization’s goals, focusing on five key areas: output and delivery, data quality and reliability, operational efficiency, incident response, and overall business impact.
| Category | Critical KPI | Description |
|---|---|---|
| Delivery | Cycle Time | Time from question to actionable insight |
| Quality | Data Accuracy Rate | Percentage of records matching ground truth |
| Quality | Data Freshness | Time between data creation and availability |
| Efficiency | % Automated Pipelines | Share of pipelines running without manual effort |
| Reliability | SLA Compliance | Percentage meeting freshness or uptime targets |
| Response | MTTR (Mean Time to Recovery) | Average time from alert to resolution |
Teams often see fewer failures and faster delivery when pipeline automation exceeds 80%. Maintaining an automated deployment success rate above 95% is considered the gold standard for boosting team confidence and ensuring predictable release schedules. As Kevin Hu, PhD, Co-founder of Metaplane, emphasizes:
"If your stakeholders do not trust your data, they will not only refrain from using it now, but can be turned off from data in perpetuity".
Set SMART goals (Specific, Measurable, Achievable, Relevant, and Time-bound) for observability. Use historical data to establish baselines for volume and freshness before implementing new monitoring systems. Assign ownership for every stage of your data lifecycle - from source to transformation, governance, and observability - and define Service Level Agreements (SLAs) for accountability.
Step 2: Find Root Causes with Data Analysis
Now that you've set your KPIs in Step 1, it’s time to figure out why problems are happening. With workflows mapped and KPIs established, the goal here is to identify where errors originate. If the same fixes keep coming up, it’s a sign to dig deeper.
Did you know data professionals spend an average of 19 hours resolving a single data quality issue? Most of that time is spent just identifying the root cause. On top of that, teams typically face one major incident per year for every 15 tables in their environment. This makes having solid diagnostic methods a must for resolving issues effectively.
Use Diagnostic Analytics
To pinpoint the root cause, follow your DAG upstream to find the first error node. This "point of origin" method helps separate the real source of the issue from downstream symptoms. As Monte Carlo puts it:
"To understand what's broken, you will need to find the most upstream nodes of your system that exhibit the issue".
Structured techniques like the "5 Whys" can help. By repeatedly asking "Why?" you can move beyond surface-level symptoms to uncover deeper, systemic problems. For more complex issues, tools like Fishbone (Ishikawa) diagrams are useful for categorizing causes - whether they stem from people, processes, or environmental factors. The Pareto Principle is often at play here: 80% of system effects typically come from just 20% of root causes. Prioritize those critical few for maximum impact.
Real-world examples show the power of root cause analysis. In October 2024, Gatwick Airport used Splunk to identify inefficiencies, boosting air traffic to 55 movements per hour and enabling 95% of passengers to clear security in under five minutes. Similarly, Japanese retailer Niki Golf adopted Splunk SIEM and automated root cause tools, achieving 75% faster incident response and cutting manual troubleshooting workloads by 50%.
Segment your data - by user type, region, or time period - to see if the issue is widespread or localized. Don’t forget to check recent code, logs, and metrics to rule out non-data problems like permission errors or network timeouts. These steps will set the stage for an effective resolution process.
Work with Stakeholders
Root cause analysis works best as a team effort. Bring together a multidisciplinary group that includes data analysts, subject matter experts, and a facilitator. Each member plays a unique role: data owners manage communication and decision-making, business users provide context and validate solutions, and IT engineers address technical infrastructure issues. Use your diagnostic findings to guide these discussions.
Before diving into detailed analysis, assess the "blast radius" - how many downstream dashboards or business decisions are impacted. If the problem only affects a rarely used dashboard, it might not need immediate attention. Surveys and stakeholder interviews can reveal how long the issue has existed, who it affects, and what specific challenges it creates in daily operations.
Set up regular feedback channels, like "brown bag" sessions or internal ticketing systems, where stakeholders can report data concerns or request features. Document past incidents in a shared repository - data quality problems often recur due to similar schema changes or vendor issues. As Atlan highlights:
"Identifying and fixing the root cause ensures the integrity of the data and systems... Effective root cause analysis helps to maintain the trust of stakeholders and clients".
Finally, foster a blameless culture that focuses on process failures rather than individual mistakes. This encourages open reporting and better data collection during analysis. Keep a central log of post-mortems so your team can quickly reference successful solutions when similar issues arise. These insights will be invaluable as you move forward with the PDCA cycle.
Step 3: Make Iterative Improvements with the PDCA Cycle
Now that you've pinpointed the root causes in Step 2, it's time to take action using the Plan-Do-Check-Act (PDCA) cycle. This four-step model provides a structured way to test and implement changes, based on the scientific method of "hypothesis-experiment-evaluation" . It’s designed to be repeated continuously, with each success forming the foundation for further improvement . This ongoing process ensures your data practices stay aligned with evolving business needs.
The PDCA cycle has delivered impressive results in real-world scenarios. For example, a software development team at a major banking group slashed defects from 93 to 8 per release cycle - a 91% improvement - within just three months. They also boosted on-time milestone delivery from 9% to 100%. Similarly, a web application testing team reduced false bug reports from 24% to 4% - an 83% drop - over the same period. Even on a larger scale, companies like Nike have reportedly doubled their size, from $100 billion in 2015 to over $200 billion in 2021, by incorporating PDCA with other quality management approaches. These examples highlight how the cycle can drive meaningful progress across different industries.
Plan Changes Based on Data Insights
Start by defining the problem using insights from your earlier diagnostic efforts. Tools like Fishbone diagrams, Pareto charts, and the 5 Whys are invaluable for crafting a clear hypothesis . Set SMART goals (Specific, Measurable, Achievable, Relevant, Time-bound) to create clear success metrics. For instance, instead of a vague goal like "improve data quality", aim for something specific like "reduce schema validation errors by 50% within 30 days."
Document your baseline metrics to track progress effectively. If your current error rate is 15 incidents per week, record that number - it’ll serve as a reference point. Break larger initiatives into smaller, manageable tasks to reduce risk. Also, secure leadership and stakeholder support before launching any pilot programs. Without their backing, it can be challenging to standardize successful improvements later.
Once your plan is in place, move forward with small-scale testing.
Test and Measure Results
In the "Do" phase, start implementing your planned changes on a small scale . This could mean running a pilot program, conducting an A/B test, or focusing on a single team or workflow. Testing on a smaller scale minimizes disruption and allows for quick adjustments if needed. Be sure to document everything - actions taken, observations, and any deviations from the plan .
Next comes the "Check" phase, where you evaluate the results of your pilot against the baseline and the success metrics you established earlier . Use tools like statistical analyses, dashboards, or Pareto charts to identify trends and areas for improvement . For instance, if your goal was a 50% reduction in errors but you only achieved 30%, dig deeper to understand why.
If the pilot proves successful, move on to the "Act" phase by standardizing the new process. This could involve updating documentation, creating new standard operating procedures (SOPs), and training staff . For example, the banking group's software team incorporated visual management boards, daily flash meetings, and a developer checklist into their workflow - tools that became permanent after the pilot's success.
Step 4: Set Up Feedback Loops and SMART Goals
Making changes stick - and ensuring they evolve - is no small feat. This is where feedback loops and SMART goals become essential. Feedback loops take the output of a system and feed it back as input, creating a cycle of continuous evaluation and improvement. Teams with well-defined KPIs often see performance improve by up to 30% compared to those without clear metrics. Additionally, businesses that implement regular check-ins and group accountability are 70% more likely to achieve their goals.
SMART goals provide clear benchmarks, while feedback loops help validate progress at every step. Glenn Rogers, CEO of Float, highlights the importance of embracing feedback:
"Seek continuous improvement by welcoming feedback rather than defending against it. Your self-improvement journey requires education, seeking advice from others, and a willingness to be wrong".
Let’s dive into practical ways to incorporate these feedback mechanisms into your workflow.
Build Feedback Loops with Real-Time Data
A strong feedback loop requires four key elements: data collection, analysis, implementation, and review. Combining real-time monitoring (like A/B testing) with retrospective methods (such as sprint reviews) allows teams to adapt quickly when things go wrong and learn from long-term trends.
Take Tesla as an example. By leveraging real-time user experience data, the company continuously improved its vehicle software. This approach led to a 50% boost in user satisfaction for customers receiving regular over-the-air updates. Similarly, Amazon uses a Lean process improvement model, analyzing customer feedback and purchase patterns to adjust inventory and personalize recommendations. This continuous loop has played a role in Amazon’s 2023 revenue exceeding $469 billion.
Visual management tools like dashboards (e.g., Tableau or CloudWatch) are invaluable for presenting real-time data in a clear, actionable way. These tools can improve stakeholder engagement by 25%. For the best results, aim to collect data within 24 hours, which can increase response rates by up to 60%.
When conducting retrospectives, try the "Stop, Start, Keep" framework. This method organizes feedback into three categories: Stop (inefficient actions), Start (new ideas), and Keep (successful practices). It’s a straightforward system that encourages teams to act on insights rather than just gather them.
With feedback loops in place, the next step is to align these insights with your organization’s broader goals.
Align Goals with Business Objectives
Before diving into any data project, meet with department leaders to define what success looks like for them. As Kishan Shetty, Lead Data Analyst, explains:
"Aligning data analytics with business objectives transforms analytics from a technical function into a strategic partner".
The PDCA (Plan-Do-Check-Act) cycle demonstrates how aligning data insights with business objectives creates a foundation for ongoing improvement. Start by defining measurable KPIs that connect data to business impact - metrics like customer churn rate, revenue growth, or operational cycle time. Break long-term goals into smaller, manageable milestones to make progress more achievable. For instance, implementing automated validation processes could aim for a 20% reduction in data errors within six months, while automating manual tasks might cut data analysis time by 30% over a single quarter.
Set clear deadlines and schedule regular review cycles, such as quarterly check-ins, to track progress. Organizations with clearly defined objectives often see a 20-25% productivity boost, while companies that use data analytics effectively report a 5-6% productivity increase.
When reporting outcomes, focus on the broader business impact rather than just presenting raw numbers. Use visualizations to help non-technical stakeholders grasp the significance of the data. Once a goal is achieved, document the improved process in the "Act" phase of the PDCA cycle. This ensures the changes become part of the standard workflow and prevents teams from slipping back into old habits.
Step 5: Use Technology and Agile Methods
Building on the iterative improvements from the PDCA cycle, this step focuses on integrating technology and agile methods to refine and streamline data workflows.
When data teams combine advanced tools with agile practices, they can adapt quickly to evolving business demands. The most effective data operations rely on a balance between robust technology and efficient workflows. Without this harmony, even the best tools fall short of delivering sustained improvements. This step goes beyond earlier methods by embedding continuous improvement into both technology and workflows.
At the heart of this approach is treating analytical logic as code. As Tristan Handy, Founder & CEO of dbt Labs, explains:
"Analytical systems are software systems. Therefore, in developing large-scale, mission-critical data systems, many of the best lessons that can be learned come directly from software engineering."
By adopting a code-first mindset, teams can implement version control, automated testing, and continuous integration. This makes data assets easier to manage and maintain. Readable code - whether in SQL or Python - enables peer reviews, testing, and ongoing improvements. Given that data quality issues cost companies an average of $12.9 million annually, these practices are not just helpful - they’re essential.
Use Modern Data Tools and Platforms
Modern cloud platforms like Databricks, Snowflake, and AWS offer powerful features that help teams optimize their workflows. These platforms allow teams to isolate workloads, automate deployments, and scale computing resources as needed. For instance, using table clones for testing can save costs since platforms like BigQuery and Snowflake charge only for incremental data rather than duplicating entire datasets.
Infrastructure as Code (IaC) plays a critical role here. Tools like Terraform let teams manage clusters, jobs, and workspaces through configuration files, eliminating the need for manual setups. Separating development, staging, and production environments ensures that changes are thoroughly tested before reaching end-users.
Automation is another cornerstone. Every production artifact should have automated unit, data, and integration tests. Code reviews are equally important - they can reduce errors in maintenance changes from 55% to as low as 2%. Some organizations have even reported error reductions of up to 80% through rigorous review processes. Additionally, automated monitoring - such as using system views like QUERY_HISTORY to trigger alerts for job failures or cost spikes - further enhances system reliability.
Adopt Agile Practices
While modern tools improve system dependability, agile practices ensure teams can adapt quickly and achieve incremental progress.
Agile workflows, including sprints, retrospectives, and daily stand-ups, help teams break down large goals into manageable tasks. By delivering value in short sprints (typically two weeks), teams can address shifting priorities and incorporate frequent stakeholder feedback. Research shows that agile organizations are 70% more likely to rank in the top quartile for organizational health, a key indicator of long-term success.
Focusing on delivering "thin slices" of work - fully implemented and tested functionality - ensures outputs address real business needs rather than theoretical ones. For example, instead of building an entire data warehouse upfront, a team might start with a specific dashboard or report to answer an immediate business question.
DataOps, which applies DevOps principles to data pipelines and analytics, is another vital practice. According to Snowflake:
"The primary goal of the DataOps methodology is to build increasingly reliable, high-quality data and analytics products that can be rapidly improved during each loop of the DataOps development cycle."
A strong testing framework is essential. This includes unit tests for code logic, integration tests for pipeline flows on sampled data, and data quality tests to validate outputs (e.g., checking for null values or unexpected row counts). Ensuring environment parity - where development and staging environments closely mirror production - helps avoid the common "works in dev, breaks in prod" issue. Moreover, automated processes save teams an average of 3.4 hours per week, with 81% of professionals reporting higher productivity.
For those looking to deepen their expertise, DataExpert.io Academy offers boot camps and subscriptions that feature hands-on training, capstone projects, and access to platforms like Databricks, Snowflake, and AWS.
Step 6: Monitor and Maintain Improvements
Even the most well-designed workflows can falter without consistent monitoring and a commitment to growth. Keeping an eye on key metrics and fostering a culture of learning ensures that improvements stick and evolve over time.
Track Key Metrics Over Time
The foundation of sustaining improvements lies in tracking critical metrics. One such metric is data downtime - the periods when your data is incomplete, inaccurate, or unavailable. Barr Moses, CEO of Monte Carlo, highlights its importance:
"Data downtime - periods of time when your data is partial, erroneous, missing, or otherwise inaccurate - is an important data quality metric for any company striving to be data-driven."
To calculate data downtime, use this formula:
Number of incidents × (average TTD + average TTR).
High-performing teams aim for a median TTD (time to detection) of under 4 hours during business hours and a median TTR (time to resolution) of under 24 hours. Most organizations also target table uptime of above 95%.
Layered monitoring adds another layer of security. For example:
- Data Diff monitors help during migrations.
- Schema Change monitors catch upstream alterations.
- Metric monitors track row counts and data freshness to maintain production health.
Additionally, keep an eye on slow-running queries over a 30-day period to address performance issues before they escalate. Regularly reviewing unused tables and dashboards can also cut infrastructure costs by ensuring teams rely only on trusted, up-to-date sources .
While automation can detect up to 90% of anomalies, manual reviews remain critical for handling more nuanced issues. The key is acting quickly once problems are identified.
Build a Culture of Continuous Learning
Metrics alone aren’t enough - teams need to embrace a mindset of ongoing improvement. Regular retrospectives are a great way to pinpoint and implement process enhancements. Peer reviews and fostering a sense of psychological safety encourage both quality and continuous learning.
Glenn Rogers, CEO of Float, emphasizes the importance of feedback:
"Seek continuous improvement by welcoming feedback rather than defending against it. Your self-improvement journey requires education, seeking advice from others, and a willingness to be wrong."
Encouraging team members to take on multiple roles - such as switching between engineer, analyst, and decision-maker - can help them understand workflows holistically and reduce siloed thinking. Standardizing best practices through clear SOPs, checklists, and documentation ensures that successful habits become part of daily operations .
For those looking to sharpen their skills further, platforms like DataExpert.io Academy offer boot camps, capstone projects, and access to tools like Databricks, Snowflake, and AWS. They also provide career development resources and a thriving community for learners to connect and grow.
Conclusion
Using the step-by-step framework outlined earlier, you can make lasting improvements to your data operations.
Consistent progress relies on structured processes, effective tools, and a team-oriented approach. By treating analytical systems like software systems and applying frameworks such as PDCA or DMAIC, data teams can implement small changes that lead to substantial long-term results.
For instance, data-driven process improvements can increase productivity by 20–30% and cut defects by as much as 40%. Real-world examples highlight this impact: Toyota reduced production defects by 45% using Six Sigma methodologies, while JPMorgan Chase enhanced fraud detection accuracy by 35% and decreased false positives by 45%.
The PDCA cycle and agile practices show how small, consistent improvements can add up to meaningful outcomes. Success thrives on cross-functional collaboration and a willingness to adapt roles as needed. As Tristan Handy, Founder & CEO of dbt Labs, explains:
"The best organizations encourage talented people to flex between these different personas. They allow them to take an idea and get curious about it, to explore it without needing to file a ticket or wait for anyone else."
One essential principle to keep in mind is the 10x9 Rule: achieving each additional "nine" of reliability comes with exponentially higher costs. The focus shouldn't be on perfection but on finding a balance - delivering enough reliability to meet business goals without overextending resources. Prioritize practical quality, automate whenever possible, and keep the team engaged with regular feedback and retrospectives.
For hands-on learning opportunities, check out DataExpert.io Academy. Their boot camps in data and AI engineering include capstone projects and access to tools like Databricks, Snowflake, and AWS. By incorporating these principles into your daily workflow, you can drive ongoing improvement and create meaningful change within your data team.
FAQs
Which KPIs should our data team track first?
To truly showcase your data team's contribution, center your attention on KPIs that highlight business value and operational efficiency. Start with data quality metrics - focusing on accuracy, consistency, and completeness. These ensure the data driving decisions is trustworthy and actionable.
Next, incorporate operational metrics like processing speed and the reduction of data requests to measure how well workflows are functioning. Over time, broaden your scope to include metrics such as data usability and uptime, aligning your team's efforts with the organization's broader objectives. This approach not only underscores your team's value but also fosters ongoing improvements.
How can we quickly identify the root cause of recurring data issues?
To pinpoint the root cause of recurring data problems, adopt a structured root cause analysis (RCA) specifically designed for data quality challenges. This involves methodically investigating your data pipelines, including the ingestion, transformation, and storage stages. Tools like data lineage and observability platforms can be incredibly useful here, allowing you to trace errors back to their source and map out dependencies visually. Additionally, fostering collaboration between teams and continuously refining workflows can streamline the resolution process and reduce the chances of the issue happening again.
What should we monitor to keep improvements from slipping?
Keeping data workflows and outcomes on track requires consistent monitoring of critical factors such as data quality (accuracy, consistency, completeness) and system performance (latency, reliability, error rates). Implementing tools for data observability can make a big difference here. These tools help identify anomalies, monitor data freshness, and ensure compliance with relevant standards.
To stay ahead of potential problems, make it a habit to review metrics regularly. Setting up alerts for key indicators allows you to address issues promptly, ensuring processes run smoothly and improvements don’t lose momentum.