
Case Study: Caching with Databricks for Faster Analytics
I cut repeat query work by keeping hot data close to compute instead of rereading cloud storage all day. In this case, warm-cache runs, better file layout, and tighter pruning took scans from 2.3 TB down to 8 GB, dropped daily DBU use from 847 to 223, and lowered monthly compute cost from $47,000 to $12,700.
If you want the short version, here it is:
- I used Disk Cache for repeated reads of Delta and Parquet data on SSD-backed workers.
- I used Spark cache for intermediate data reused inside jobs.
- I used SQL result caching for the same dashboard queries run again and again.
- I checked cold vs. warm runs to confirm the cache was helping.
- I paired caching with filter pushdown and better file layout, because cache alone was not the whole story.
- I avoided caching too much on shared clusters to reduce memory pressure and restart risk.
A few numbers stand out:
- 99.6% less data scanned
- 73.7% lower daily DBU use
- 73% lower daily compute cost
- $34,300 less per month in compute spend
Here’s the plain takeaway: cache works best when people keep reading the same stable data. It helps less when every query is different.
| Cache layer | Best use |
|---|---|
| Disk Cache | Repeat reads of Delta/Parquet from remote storage |
| Spark cache | Reused DataFrames inside Spark jobs |
| SQL result cache | Same query text run again |
| Serverless internal cache | Serverless SQL Warehouse workloads |
My main takeaway: use caching for repeat reads, not as a fix for weak table layout or random query patterns.
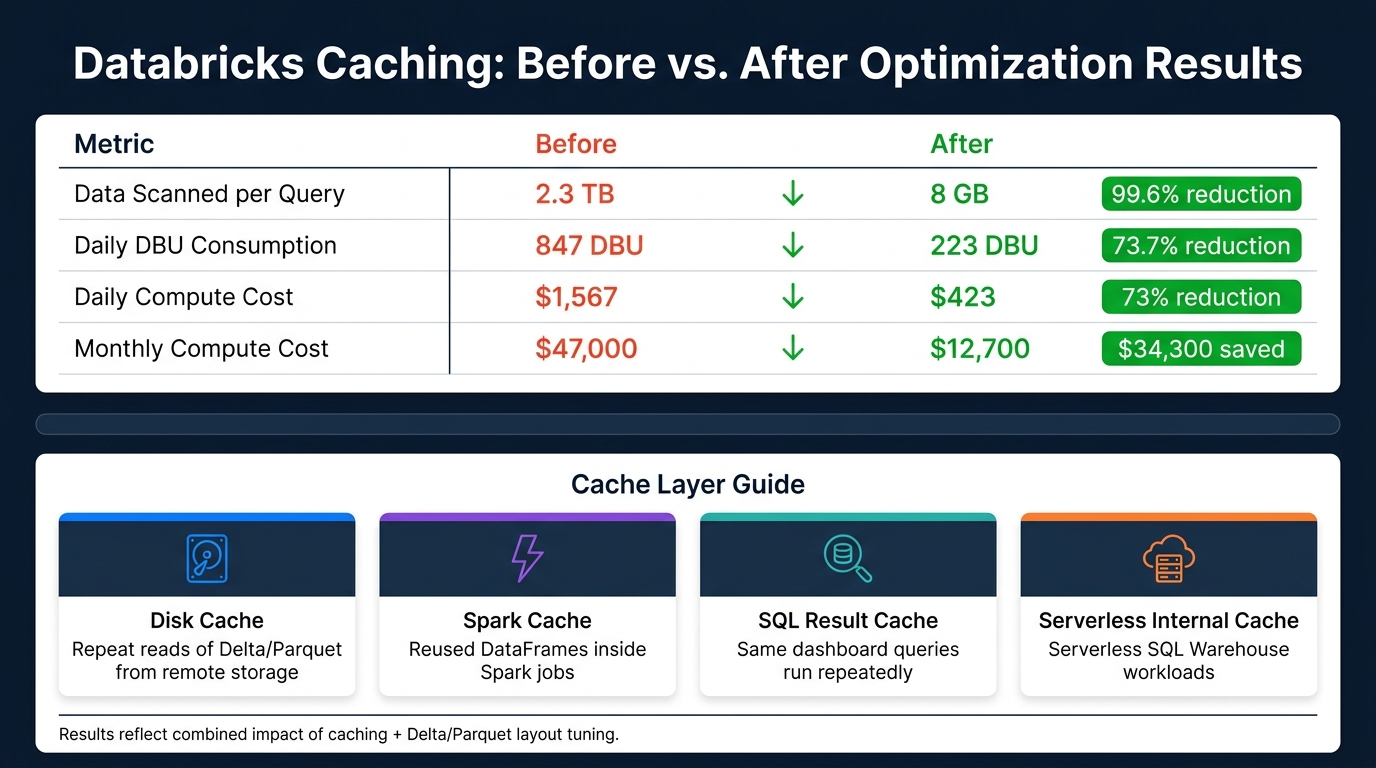
Databricks Caching Results: 99.6% Less Data Scanned & 73% Cost Savings
Databricks - Delta Caching vs PySpark Caching/Persist - Introduction

Caching Strategy in Databricks
To cut repeated object-store reads, the team paired each access pattern with the right cache layer. The idea was simple: use the right cache for the right kind of repeat work.
Repeated scans on stable Delta and Parquet tables went to Disk Cache. Reused intermediate data went to the Spark cache. And for identical queries, SQL result caching did the job.
Using Disk Cache for Repeated Delta and Parquet Reads
Disk Cache was the main tool here. It lined up well with repeated scans on stable Delta and Parquet tables, and once enabled, it didn't require query changes.
That matters more than it might seem. If a team can speed up repeated reads without rewriting SQL or changing pipelines, adoption gets a lot easier.
When SQL Result Caching Also Helped
For some dashboard queries, the team also got good results from SQL result caching. This was a good fit for recurring dashboard loads and exact-match analyst queries.
Same query in, same result out. In cases like that, result caching can save a lot of repeat work.
Setup Factors That Affected Cache Effectiveness
Not every cluster setup performs the same way. A few things had a direct effect on how much the cache helped:
| Factor | Why It Mattered |
|---|---|
| SSD-backed workers | Disk Cache relies on local SSD storage on the workers. |
| Delta or Parquet format | These file formats are the best match for Disk Cache. |
| Stable query patterns | Repeated access to the same tables or files increases cache reuse. |
| Data layout | Data skipping, Z-ordering, and clustering reduced the amount of data cache had to serve. |
Turning on Disk Cache with spark.databricks.io.cache.enabled = true was straightforward. But the biggest gains came from spotting stable query patterns early, before the team flipped the switch.
With the cache layers picked, the next step was enabling cache on the cluster and checking which tables were actually warming.
Implementation Steps and Validation
Enabling the Cluster and Selecting Target Tables
The team turned on spark.databricks.io.cache.enabled = true at the cluster level. That let repeated reads stay on local worker storage instead of pulling the same data over and over. They focused first on the BI and analytics tables people hit most often. Before caching, they converted raw sources to Delta or Parquet.
After that setup was in place, they reran the same queries to see how much the cache helped.
Running Warm-Up Queries and Confirming Cache Usage
The cache fills on the first read. So the first run did the heavy lifting, and later runs got much faster once the data was warm. The difference showed up fast: one query fell from 2.4 seconds to 0.1 seconds on the second run. In query history, they also checked that later runs scanned less remote data.
After they confirmed the cache was doing its job, they moved on to layout and pruning so each query had to touch less data in the first place.
Tuning Decisions That Improved the Final Outcome
Two changes made the biggest difference.
- The team pushed filters as early as possible, so only the data they needed had to be cached or processed later.
- They also improved file layout with
repartitionandsortWithinPartitionsbefore writing. That change cut DBU usage by 30%.
They didn't use Z-ordering on every high-cardinality column. In some cases, targeted zone maps or Liquid Clustering cost less and still fit the access pattern better. They also turned on dynamic allocation so executor counts could track the workload more closely.
sbb-itb-61a6e59
Performance Results: Before and After Caching
Baseline vs. Cached Query Performance
After the cache warmed up, the team compared cold runs against warm-cache runs on the most-used tables. They also tracked scanned bytes to see how much work the system still had to do.
The table below separates speed gains from the broader drop in scanned data. One thing to note: the scan and cost numbers reflect both caching and layout tuning, not caching by itself.
| Metric | Baseline | After Optimization | Change |
|---|---|---|---|
| Data scanned per query | 2.3 TB | 8 GB | 99.6% reduction |
| Daily DBU consumption | 847 DBU | 223 DBU | 73.7% reduction |
| Daily compute cost | $1,567 | $423 | 73% reduction |
| Monthly compute cost | $47,000 | $12,700 | $34,300 savings |
That’s a huge drop. Going from 2.3 TB scanned per query to 8 GB changes the shape of the workload in a big way. The cost side tells the same story: daily spend fell from $1,567 to $423, and monthly compute cost dropped from $47,000 to $12,700.
Impact on Analyst Workflows and Compute Usage
For analysts, the main win was speed on repeat work. Warm-cache runs made frequent dashboards and repeat queries faster, especially when the same tables were loaded again and again. In practice, pre-cached tables gave those repeated loads a faster start.
That matters because analyst work is often repetitive by nature. A dashboard gets opened, refreshed, filtered, and reopened throughout the day. When those common tables are already sitting in cache, the wait feels shorter and the workflow feels less clunky.
The remaining question is where caching drove most of the improvement, and where layout tuning did more of the heavy lifting.
Lessons Learned and Conclusion
The strongest results showed up when queries kept hitting the same data. That makes the rule pretty simple: cache repeat reads, not every query.
Where Caching Delivered the Biggest Gains
Caching helped most when the same data was read again and again in a steady pattern. BI dashboards refreshed throughout the day were a good example. Once the cache was warm, these repeat-read workloads saw the clearest latency gains.
That lines up with what Databricks Disk Cache does best. It keeps repeated reads on local SSDs instead of pulling them from object storage each time. The same pattern shows up in iterative work, like ML training or other repeated scans over the same data.
For BI tools, pre-caching often-used tables is a practical way to warm the cache early. That helps keep the first analyst queries low-latency.
Where Caching Had Limited Impact and How to Choose the Right Cache Layer
Caching is a weaker fit for highly ad hoc analysis. If filters and joins keep changing, and the same data rarely gets reused, the cache has less to work with.
It also works a bit differently on Serverless SQL Warehouses. Standard CACHE TABLE commands may not behave the same way they do on standard Spark clusters because Serverless relies on its own internal caching mechanisms.
There’s also a cost to caching too much. In shared clusters, over-caching can eat up memory and lead to driver restarts or OOM errors. If you use Spark .cache() or .persist(), call unpersist() as soon as that data is no longer needed.
| Scenario | Recommended Cache Layer |
|---|---|
| Repeated reads of Delta/Parquet from remote storage | Disk Cache (Delta Cache) |
| Reused intermediate DataFrames in a single Spark job or ML workflow | Spark Cache (.cache() / .persist()) |
| Serverless SQL Warehouse workloads | Use built-in internal caching |
Key Takeaways for Databricks Practitioners
Before rolling caching out across the board, check whether the workload is even a good fit. The simplest test is to compare cold runs with warm runs. That shows whether caching is cutting latency or just using up cluster resources.
Caching works best when file layout and pruning are already in good shape. In plain English, caching should sit on top of sound Delta or Parquet layout, not try to patch over weak layout choices.
So the practical playbook is straightforward:
- Validate cold vs. warm runs before caching widely
- Cache stable repeat reads instead of unpredictable query patterns
- Pair caching with Delta/Parquet layout optimization rather than using it as a substitute
In Databricks, caching should cut repeat I/O, not make up for poor data layout or unstable query patterns.
FAQs
When should I use Disk Cache instead of Spark cache?
Use Disk Cache to speed up reads by keeping copies of remote Parquet or Delta files on the local SSDs attached to worker nodes. It’s a good fit for query-heavy workloads, and the system handles it for you.
Use Spark cache when you want to manually store intermediate DataFrame results that get reused in later actions, so Spark doesn’t have to do the same work again.
How can I tell if caching is actually improving my queries?
Monitor execution time before and after you apply a cache. Run the same job or query both ways and compare the runtime to see if performance gets better.
Spark caching is lazy, so nothing is stored in memory until you trigger an action. A simple action like count will materialize the data. After that, check the Spark UI to make sure the cache is active and look for bottlenecks such as shuffle operations or disk spills.
Why didn’t caching alone drive all cost savings?
Caching can make iterative work and query-heavy jobs run faster because it cuts repeat processing.
But it doesn't fix every cost issue in an analytics pipeline.
You also save money by avoiding oversized dataset scans, cutting back on pricey cluster setups, and cleaning up poor data layout. Things like partitioning, file pruning, and lower-cost compute options matter too.