
Case Study: Improving Dashboard Speed with Snowflake
Key Takeaways:
- Sub-second load times: Snowflake’s tools like Result Cache and Search Optimization Service can drastically reduce dashboard delays.
- Cost savings: Efficient query tuning and warehouse configurations can cut compute costs by up to 40%.
- Common bottlenecks: Issues like warehouse contention, inefficient pruning, and disk spillage can be resolved with Snowflake’s features.
- Optimization strategies: Use caching, clustering keys, and materialized views for better performance.
Results:
- Companies achieved up to 10x faster query times, reduced infrastructure costs by 60%, and enhanced decision-making efficiency.
This guide provides a straightforward framework for diagnosing and fixing dashboard performance issues using Snowflake’s built-in tools and techniques.
The Missing Manual: Everything You Need to Know about Snowflake Optimization | SELECT

sbb-itb-61a6e59
Finding Performance Bottlenecks
Snowflake Dashboard Performance Bottlenecks: Diagnostic Indicators and Solutions
Baseline Metrics and Analysis
To identify performance issues, start with Snowsight's Query Profile. This tool provides a visual breakdown of query execution, spotlighting resource-heavy nodes like TableScans, Sorts, or Join operations. The "Most Expensive Nodes" section is your go-to for pinpointing where time and resources are being consumed.
"The biggest mistake in Snowflake optimization is fixing the wrong thing. Before touching any query, open the Query Profile in Snowsight and look at the Most Expensive Nodes section."
– Nikesh Vora, Technical Product Manager, Coefficient
Key metrics to review include:
- Total elapsed time: How long the query takes from start to finish.
- Partitions scanned vs. partitions total: Indicates pruning efficiency.
- Bytes spilled to remote storage: Highlights memory-related issues.
Running a diagnostic query against INFORMATION_SCHEMA.QUERY_HISTORY can help you spot queries that take over 60 seconds or show nonzero remote spillage. Comparing P50 (median) and P99 (worst-case) query durations can also help you differentiate between widespread problems and isolated anomalies. These metrics set the stage for identifying and addressing the bottlenecks discussed below.
Diagnosing the Main Issues
Using these metrics, you can uncover the root causes of performance bottlenecks. Here are six common culprits:
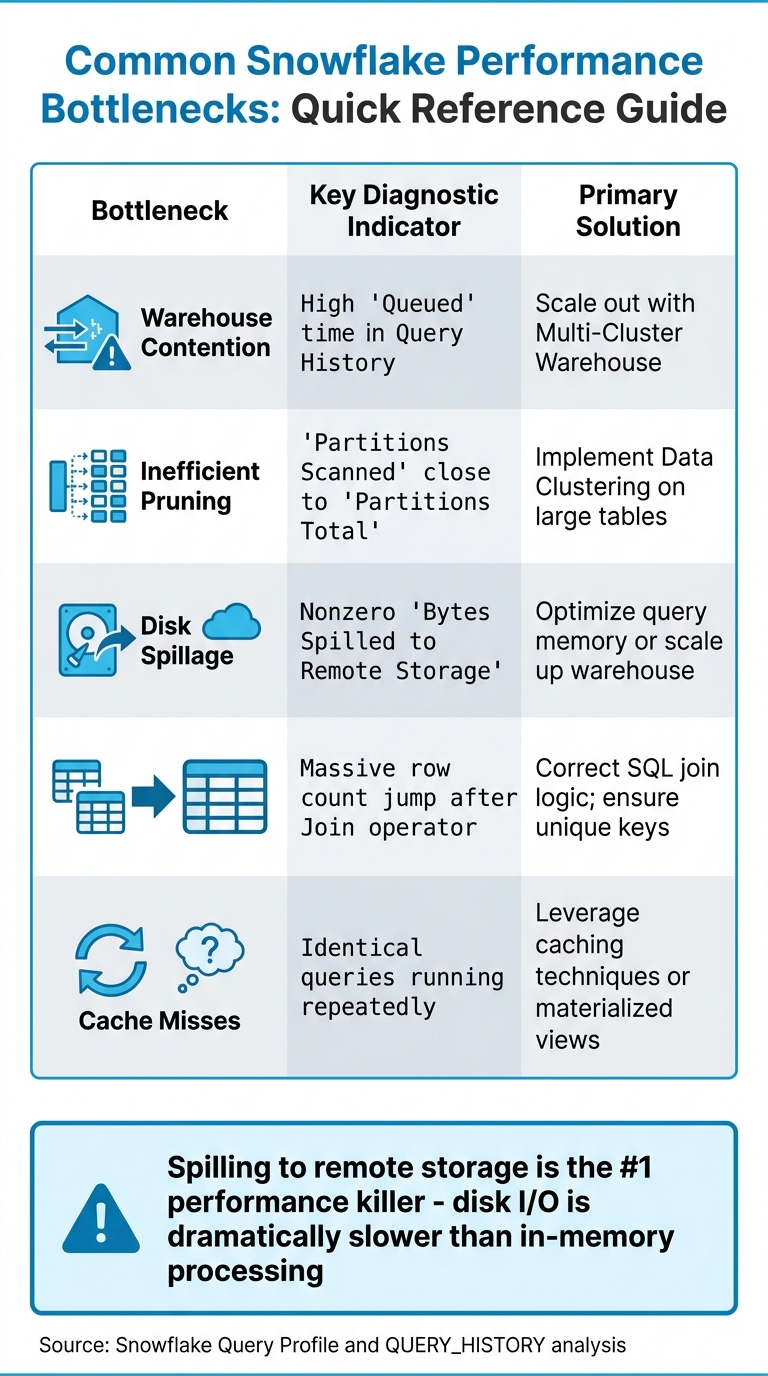
- Warehouse Contention: This happens when multiple queries compete for limited resources, leading to queuing delays.
- Inefficient Pruning: If Snowflake scans nearly all micro-partitions because filters don’t align with the table’s structure, you’ll see "Partitions Scanned" matching "Partitions Total." This often signals a lack of proper clustering.
- Disk Spillage: When intermediate query results exceed available memory, data spills to local SSDs or remote cloud storage. This can slow queries down by up to 10×.
- Exploding Joins: Poor join logic or missing keys can cause row counts to balloon, overwhelming compute resources.
"Spilling to remote storage is often called the '#1 performance killer' because disk I/O is dramatically slower than processing in memory."
– DataCouch
| Bottleneck | Key Diagnostic Indicator | Primary Solution |
|---|---|---|
| Warehouse Contention | High "Queued" time in Query History | Scale out with Multi-Cluster Warehouse |
| Inefficient Pruning | "Partitions Scanned" close to "Partitions Total" | Implement Data Clustering on large tables |
| Disk Spillage | Nonzero "Bytes Spilled to Remote Storage" | Optimize query memory or scale up warehouse |
| Exploding Joins | Massive row count jump after Join operator | Correct SQL join logic; ensure unique keys |
| Cache Misses | Identical queries running repeatedly | Leverage caching techniques or materialized views |
Snowflake Optimization Techniques
Adjusting Warehouse Configuration
Tackling performance bottlenecks in Snowflake often requires a mix of strategies, such as those taught in data engineering and AI courses,, starting with optimizing your warehouse size. Snowflake provides two scaling options: vertical scaling (increasing warehouse size) and horizontal scaling (adding clusters). The choice depends on whether your issue lies with slow queries or high user concurrency.
Vertical scaling, such as moving from X-Small to Small or Medium, boosts CPU and memory per node, helping to reduce slowdowns caused by remote spillage. For instance, AT&T's Lead Solution Architect, Chris Goldston, used this method during the migration of their myRESULTS reporting application. The result? Improved cost efficiency while supporting 115,000 users.
"Because of results caching and our Snowflake migration, we're now running at one-sixth of the cost that we thought we'd be operating at."
– Chris Goldston, Lead Solution Architect, AT&T
Horizontal scaling is another approach, particularly useful for managing warehouse contention. When multiple users run dashboard queries simultaneously, resource limits can lead to queries being queued. Adding clusters through multi-cluster warehouses can resolve this issue. If you see queries marked as QUEUED (WAREHOUSE_FULL) in your Query History, increasing the MAX_CLUSTER_COUNT can help.
To further optimize, set auto-suspend to at least 10 minutes (600 seconds). This keeps the warehouse cache warm, avoiding the slower performance of cold reads when the cache is dropped after suspension. Poor tuning can lead to a 30–60% increase in costs without notable performance improvements.
Once your warehouse resources are properly configured, the next step is to make the most of caching to enhance query performance.
Using Query Caching
After fine-tuning your warehouse setup, leveraging caching can significantly speed up queries. For dashboards, the Result Cache and Local Disk Cache are particularly useful. The Result Cache stores the final output of queries for 24 hours, offering fast results without additional compute costs. However, for caching to work, queries must be byte-for-byte identical - including whitespace and capitalization.
"If Snowflake query optimisation had a cheat code, it would be caching."
– Hugo Lu, CEO, Orchestra
To maximize Result Cache hits, ensure your BI tools generate consistent SQL and avoid using dynamic timestamps or session variables in query text. For critical dashboards, consider running warm-up queries (e.g., a simple COUNT(*) query) before peak usage to load data into the local warehouse cache.
For resource-intensive queries, the Query Acceleration Service (QAS) can be a game-changer. It enhances performance without requiring a permanent increase in warehouse size. AT&T, for example, combined QAS with results caching to ensure 90% of their 1 million daily API queries returned in under one second. You can enable QAS with the following command:
ALTER WAREHOUSE <name> SET ENABLE_QUERY_ACCELERATION = TRUE.
This method can reduce costs by 20–40% compared to scaling up the entire warehouse. Use the QUERY_ACCELERATION_ELIGIBLE view to identify which queries can benefit most.
Implementing Search Optimization Service
For dashboards relying on point lookups - like filtering by a single ID or customer record - the Search Optimization Service can dramatically improve performance.
Intercom serves as a great example. By integrating Snowflake’s optimization tools with Cortex AI, they reduced the time required to generate customer insight decks from 3–4 hours to under 10 minutes. This improvement saved their sales team 2,000 hours monthly and delivered an estimated $1.4 million in efficiency gains.
"Customer insight decks that once took 3–4 hours to produce are now ready in less than 10 minutes... all requiring no manual effort."
– Louis Ryan, Senior Director of Data Science, Intercom
SecurityScorecard took a different route, using pre-aggregations to cut their Snowflake query requests in half and reduce infrastructure costs by 60%.
When using interactive warehouses for real-time dashboards, allow enough time for the cache to warm after resuming. This ensures consistent, low-latency performance. For benchmarking, temporarily disable the USE_CACHED_RESULT session parameter to get accurate measurements of table data cache performance. These combined techniques provide a strong foundation for optimizing dashboard performance in Snowflake.
Implementation Steps
Step 1: Configure the Snowflake Environment
Start by setting up virtual warehouses specifically for BI and dashboarding tasks to avoid conflicts with ETL jobs and ad-hoc queries. This ensures smoother operations and resource allocation.
Enable multi-cluster warehouses in "Auto-scale" mode using the "Standard" scaling policy. Adjust the MAX_CLUSTER_COUNT based on the number of expected concurrent users, and set AUTO_SUSPEND to 10–20 minutes. This helps maintain a warm local disk cache for faster performance.
To avoid resource monopolization, configure STATEMENT_TIMEOUT_IN_SECONDS to 15 minutes. Fine-tune MAX_CONCURRENCY_LEVEL - typically set at 8 - to balance simultaneous query execution with available resources. Adjustments may be needed depending on workload patterns.
"Performance, latency, and concurrency are more than fixed technical specs; they're business requirements that need to be defined and justified like any other product feature." – Well Architected Framework Team, Snowflake
Step 2: Optimize Queries and Workloads
Once the environment is set, focus on refining queries to make the most of the optimized setup.
Use the Query Profile tool to identify inefficiencies like pruning issues or disk spillage. Replace function-wrapped filters (e.g., YEAR(order_date) = 2025) with simpler conditions like order_date >= '2025-01-01' to improve partition pruning and reduce I/O. Avoid using SELECT *; instead, specify the columns you need.
Address "exploding joins" by ensuring join keys are unique and fixing logic that creates Cartesian products. For large tables with billions of rows, define cluster keys on frequently filtered columns, such as dates or IDs, to enhance partition pruning.
Rewriting repetitive CTEs (Common Table Expressions) as temporary tables can also improve performance by eliminating redundant computations.
"The biggest mistake in Snowflake optimization is fixing the wrong thing. Before touching any query, open the Query Profile... to know where to focus." – Nikesh Vora, Technical Product Manager, Coefficient
Step 3: Apply Caching and Pre-Aggregations
After refining queries, implement caching and pre-aggregations to further boost dashboard performance.
Ensure dashboard queries are standardized to be byte-for-byte identical, which maximizes Result Cache hits. Remove non-deterministic functions in cases where caching is required.
Use Materialized Views to pre-compute complex aggregations and joins for frequently accessed metrics. These views update incrementally as new data is added. Additionally, create summary tables (rollups) for daily or weekly metrics to reduce the volume of data scanned compared to querying raw tables. Set AUTO_SUSPEND to at least 60 seconds to keep the local SSD cache warm.
Track cache performance by analyzing the QUERY_HISTORY view, specifically looking at QUERY_ACCELERATION_BYTES and BYTES_SCANNED metrics.
These strategies have been shown to achieve sub-second dashboard response times, proving how systematic use of Snowflake's optimization features can lead to significant performance improvements.
Performance Improvements and Results
Before and After Metrics
The optimizations brought about clear, measurable improvements across various areas. For example, Car and Classic achieved a staggering 10x improvement in report load times, slashing query durations from over 30 seconds to nearly instant. James Sharwin, Head of Data, noted:
"Snowflake was easy to use for any analytical use case and has every function under the sun. Load times of reports became near instant, with at least a 10x performance improvement".
GridMatrix, a SaaS provider specializing in road usage analytics, saw dashboard performance improve by 40%. At the same time, they reduced Snowflake credit usage by 40% by downsizing warehouses from XL/Medium to Small/XS tiers and refining their BI models. In the automotive sector, Snowflake Optima Indexing delivered a dramatic 15x speed boost, cutting query latency from 17 seconds to just over 1 second and increasing micro-partition pruning efficiency from 30% to 96%.
A Series B SaaS company adopted a materialized aggregation approach that improved dashboard load times by 70% and cut monthly Snowflake expenses by 62%, leading to annual savings of $180,000. Similarly, healthcare provider ESO reduced the median execution time for reporting by 60% while slashing monthly infrastructure costs by 64%.
These numbers highlight the tangible benefits of the optimizations, creating a solid foundation for broader business gains.
Business Impact
The performance improvements translated directly into operational efficiencies and cost reductions. For instance, Car and Classic's data team reclaimed 8 hours per week previously spent troubleshooting data issues, allowing them to focus on more strategic tasks. James Sharwin emphasized the importance of trustworthy data:
"You can have the best data setup and fanciest dashboards but if people don't trust the data then it's all for nothing".
At Artlist, advanced visibility tools uncovered three resource-intensive pipelines, leading to a 30% cost reduction. This saved $7,300 annually for one dashboard and an additional $2,000 per year by retiring an unused table. Hannan Kravitz, Data Engineering Team Leader, shared:
"Seemore Data gave us the visibility to understand the lineage behind our data pipelines, so now a non-technical person, such as an analyst, can understand how things are being constructed rather than having to ask the data engineering team".
The combination of faster dashboards, lower costs, and enhanced data trust has set the stage for sustainable growth and expanded adoption of BI tools. These results underscore the value of effective Snowflake configuration and optimization strategies discussed earlier.
Lessons Learned and Best Practices
Caching and Query Optimization
Improving dashboard speed and reliability in Snowflake starts with proper diagnosis. Tools like Query Profile and QUERY_HISTORY are essential for pinpointing expensive nodes and resource-heavy queries. As DataCouch puts it, "The single most important takeaway is this: diagnose before you optimize. Don't just guess."
To maximize cache efficiency, standardized SQL is key. The Result Cache stores query results for 24 hours, so keeping query formatting consistent ensures repeated dashboard refreshes pull from the cache instead of consuming extra compute credits.
Another effective strategy is isolating workloads. By segmenting tasks across different warehouses, each maintains its own cache. This prevents heavy batch jobs from interfering with the performance of interactive dashboards.
Snowflake also offers built-in features to further streamline performance and reduce costs.
Snowflake-Specific Features
Snowflake’s three-layer caching system - Result, Metadata, and Local Disk - is designed to cut execution time and costs without requiring SQL changes. For dashboards and BI use cases, Snowflake recommends setting auto-suspend to at least 10 minutes (600 seconds) to preserve cache availability for users.
For queries involving large data scans, the Query Acceleration Service (QAS) boosts performance. Organizations can identify suitable queries by checking the QUERY_ACCELERATION_ELIGIBLE view for warehouses with high eligible time ratios. In environments with high dashboard concurrency, multi-cluster warehouses automatically scale out to maintain performance without overusing credits.
When working with large tables, clustering keys ensure only relevant micro-partitions are read. This avoids full table scans. Writing SQL with pruning in mind is crucial - use conditions like WHERE order_date >= '2024-01-01' instead of WHERE YEAR(order_date) = 2024 for better results.
Maintaining Performance Over Time
Sustaining long-term performance requires constant monitoring and fine-tuning. Running diagnostic queries against snowflake.account_usage.query_history can help track metrics like percent_scanned_from_cache. If this metric is consistently low for frequent queries, increasing the auto-suspend interval can prevent caches from dropping prematurely.
One major issue to watch for is remote disk spillage, which significantly slows performance since disk I/O is far slower than in-memory processing. Monitoring for non-zero values in "Bytes Spilled to Remote Storage" within the Query Profile can highlight when queries need memory optimization or warehouse scaling. For interactive workloads, a longer auto-suspend interval (e.g., 24 hours) helps keep caches warm.
To avoid budget overruns, resource monitors with credit quotas and automated alerts are invaluable. As Datadivaai wisely notes, "Performance is not just about speed - it's about reducing wait time without adding complexity". This approach underscores the importance of well-configured warehouses, standardized SQL, and thoughtful clustering, all while avoiding unnecessary complexity.
Conclusion
Key Insights
Improving dashboard speed isn’t just about throwing more compute resources at the problem - it’s about identifying and addressing the root causes. Tools like QUERY_HISTORY and Query Profile are essential for pinpointing bottlenecks before making adjustments. Many organizations have seen noticeable performance improvements and reduced costs by focusing on the right warehouse sizing and reworking their data models, rather than simply scaling up infrastructure.
Snowflake’s caching system is another game-changer when used strategically. The Result Cache, which stores query results for 24 hours at no additional compute cost, can make a big difference. Configuring warehouses with thoughtful settings - like an auto-suspend interval tailored to keep caches warm for business intelligence (BI) workloads - helps avoid the delays caused by unnecessary cold starts.
Beyond query tuning, smart data modeling and ingestion techniques are equally critical. Findings show that optimizing warehouse size, sticking to consistent SQL practices, and using effective clustering can deliver both performance gains and cost efficiency. These lessons provide a roadmap for data professionals aiming to build faster, more cost-effective dashboards.
Next Steps for Data Professionals
The strategies outlined in this case study offer a clear framework for improving dashboard performance in Snowflake. If you’re managing Snowflake or planning to enhance your data systems, the way forward is straightforward: dedicate time to learning the platform’s built-in capabilities. Leveraging features like Query Acceleration, multi-cluster warehouses, and clustering can significantly boost dashboard performance without driving up costs.
For those looking to sharpen their skills, DataExpert.io Academy (https://dataexpert.io) offers boot camps and subscription plans focused on Snowflake optimization, data engineering, and analytics. Through practical capstone projects and access to tools like Snowflake, you’ll gain the expertise needed to identify bottlenecks, implement effective caching, and maintain efficient, high-performing data systems over the long term.
FAQs
How do I tell if my dashboard is slow due to queuing or slow query execution?
To figure out whether your dashboard's slowness is caused by queuing or query execution, you can use Snowflake tools like Snowsight or Query History. Dive into the Query Profile to spot delays such as operator bottlenecks or extensive data scans.
Queuing issues often occur when the warehouse size is too small or there's high concurrency. On the other hand, slow execution might be linked to inefficient data modeling or missing caching. Keeping an eye on these elements can help you zero in on the root cause.
Why isn’t Snowflake’s Result Cache hitting for my BI dashboard queries?
Snowflake’s Result Cache might not benefit your BI dashboard queries if the query isn't an exact match to a previous one or if the data has been modified. Even minor differences - like extra spaces, changes in aliases, or varying parameters - can make queries non-identical. Additionally, any updates to the data (such as inserts, updates, deletes, or merges) will invalidate the cache. To improve cache hits and overall performance, aim to keep queries consistent and limit recent changes to the underlying data whenever possible.
When should I use clustering keys, materialized views, or Search Optimization Service?
Clustering keys help improve query pruning and make it easier to organize data, especially for columns that are frequently filtered. For complex or repetitive queries, materialized views can significantly boost performance by precomputing and storing the results. If you're dealing with structured or semi-structured data and need fast search capabilities, the Search Optimization Service is your go-to option. Each of these tools plays a distinct role in enhancing the efficiency and speed of your queries.