
How to Monitor Security in Databricks Lakehouses
Monitoring security in Databricks lakehouses is essential to protect data and meet compliance requirements. Here’s the core approach:
- Zero Trust Architecture: Operate on the principle of "Never Trust, Always Verify" by scrutinizing every action, from data access to configuration changes.
- Key Tools: Use Unity Catalog and System Tables like
system.access.auditfor centralized logging and real-time insights. - Continuous Monitoring: Essential for detecting threats, such as failed logins or data exfiltration, and staying compliant with standards like HIPAA, PCI-DSS, and SOC 2.
- Setup Requirements: Admin access, Unity Catalog enabled, supported pricing tiers, and familiarity with Databricks SQL and cloud logging tools.
- Data Sources: Leverage system tables (
system.access.audit,system.data_classification.results, etc.) alongside cloud-native logs (AWS CloudTrail, VPC Flow Logs) for comprehensive visibility. - High-Value Assets: Prioritize monitoring sensitive data like PII and ensure proper permissions using tools like
system.information_schema.
Databricks simplifies security monitoring by automating log collection, enabling SQL-based queries, and integrating with external tools like SIEM platforms. The guide also covers advanced tools like the Security Analysis Tool (SAT) for identifying misconfigurations and Lakehouse Monitoring for tagging sensitive data and tracking lineage.
To ensure effective monitoring:
- Define security objectives and threat models.
- Use pre-built queries and alerts for real-time threat detection.
- Integrate Databricks logs with cloud and enterprise tools for broader insights.
- Build detection rules and incident response playbooks.
Regular reviews, compliance alignment, and team training are crucial for staying ahead of evolving threats. Databricks provides tools and resources to support these efforts, ensuring a secure and well-governed lakehouse environment.
Planning a Security Monitoring Strategy for Databricks Lakehouses
Defining Security Objectives and Use Cases
Before diving into crafting queries or setting up alerts, it’s essential to define your security goals. Start by aligning these goals with specific threat models.
In Databricks environments, common security concerns include account takeover, data exfiltration, insider threats, ransomware, and resource abuse (like crypto mining). Each threat requires its own detection strategy. For example, crypto mining might show up as sudden spikes in compute usage, while data exfiltration could appear as large-scale downloads of notebook or SQL results to local devices.
Two often-overlooked objectives are monitoring configuration drift and ensuring compliance. Configuration drift happens when security settings - like audit logging levels or SSO configurations - are altered without proper oversight. Compliance, on the other hand, is guided by frameworks such as HIPAA, PCI-DSS, or SOC 2, which require continuous audit trails and visibility into access activity.
"Effective monitoring is one of the key foundations of an effective Zero Trust Architecture. All too often, people can be lured into the trap of thinking that for effective monitoring it's sufficient to capture the logs that we might need and only query them in the event of an investigation or incident." - Databricks
Once you've identified specific threats, the next step is pinpointing the data sources that provide the necessary security signals.
Identifying Data Sources for Security Signals
In Databricks, the system.access.audit table serves as the primary source of security signals. This table logs key activities such as authentication events, data reads and writes, and administrative changes.
Other system tables can complement your monitoring efforts:
| System Table | Key Use Case |
|---|---|
system.access.inbound_network |
Identify denied inbound requests from restricted IPs |
system.access.outbound_network |
Track blocked outbound requests to external domains |
system.data_classification.results |
Spot tables containing PII or other sensitive data |
system.access.table_lineage |
Trace how data flows between tables |
system.information_schema |
Identify users with elevated privileges on securables |
These tables provide robust coverage for internal activities in Databricks. However, to get a complete view of your security landscape, you’ll need to integrate cloud-native logs, such as AWS CloudTrail, VPC Flow Logs, or Azure Diagnostic Logs. These logs help track data movement across your broader cloud infrastructure.
With these data sources in hand, the next step is to focus on the assets that require the most attention.
Prioritizing High-Value Assets and Shared Responsibilities
Focus your efforts on high-risk lakehouse assets, such as tables containing PII, financial data, or information subject to regulatory requirements. Use the system.data_classification.results table to identify sensitive tables and cross-reference it with system.information_schema to see who has access.
It’s also important to understand the shared responsibility model. Databricks manages tasks like patching the base compute disk images (AMIs) on a biweekly or monthly schedule, but it’s up to your team to restart clusters so patches take effect. As noted in Databricks Documentation:
"It is your responsibility to review these logs... If the agent detects a malicious activity, it is your responsibility to triage these events and open a support ticket with Databricks if the resolution or remediation requires an action by Databricks." - Databricks Documentation
While Databricks secures the platform itself, you’re responsible for securing what operates on it. This includes tasks like managing Unity Catalog permissions, tagging sensitive assets, configuring IAM roles, and handling incident response from start to finish.
For more detailed training on securing your Databricks lakehouse, check out the resources and courses available at DataExpert.io Academy (https://dataexpert.io).
sbb-itb-61a6e59
Getting started with Databricks Lakehouse Monitoring
Setting Up Databricks-Native Security Monitoring
This section explains how to implement Databricks' built-in tools to monitor and secure your environment, building on your security objectives and identified data sources.
Using Unity Catalog System Tables for Monitoring
Once you've mapped out your data sources and identified high-value assets, the next step is enabling Databricks' native monitoring tools, starting with Unity Catalog system tables.
"The
system.access.audittable serves as your system of record for all of the material events happening on your Databricks Lakehouse Platform." - Databricks Blog
To grant your security team the appropriate access, an account admin must assign USE CATALOG permissions on the system catalog and SELECT permissions on specific schemas like access or billing. Without these permissions, auditors won't be able to view the necessary data.
Once access is configured, you can use standard SQL queries on the system.access.audit table to detect unusual or suspicious activity. For example, Databricks provides a quickstart notebook with over 40 pre-built queries to monitor events such as repeated failed logins, large-scale data downloads, or potential privilege escalations. These queries can be scheduled using Databricks SQL, and alerts can be sent via email, Slack, or Microsoft Teams for real-time security monitoring. Audit logs are retained for 365 days at no additional cost.
With audit logs in place, the next step is identifying and addressing misconfigurations using specialized tools.
Configuring the Databricks Security Analysis Tool (SAT)
While system tables focus on tracking activity, the Security Analysis Tool (SAT) identifies misconfigurations in your environment. SAT is an open-source workflow that uses REST APIs to analyze your Databricks deployment against security best practices across five key areas: Network Security, Identity & Access, Data Protection, Governance, and Informational.
Here’s how to set it up:
- Import the SAT repository into your Databricks workspace.
- Adjust access settings based on your cloud provider (AWS, Azure, or GCP).
- Run the Initializer notebook to collect workspace data, verify connections, and configure the dashboard.
- Provide PAT tokens for each workspace you want to monitor and customize the checks you wish to enable or disable.
- Schedule the SAT workflow to run daily for ongoing monitoring.
The SAT evaluates your environment against 37 security best practices and highlights deviations based on severity. Each flagged issue includes a Check ID that links to detailed remediation steps, so your team knows exactly how to address it. The dashboard also features a "Security Deviation Trend" view, which can help identify sudden spikes in deviations - these often point to unauthorized changes or errors. As of May 2026, version 0.8.0 includes 11 new checks, such as live egress testing and per-user identity analysis in permissions.
It’s worth noting that SAT is provided "AS-IS" and is not covered under Databricks SLAs. While it's a powerful diagnostic tool, it should be used alongside other security measures.
Using Lakehouse Monitoring for Security Insights
Once you've established baseline configurations with the SAT, you can enhance your security insights using Lakehouse Monitoring.
Lakehouse Monitoring employs AI to automatically tag sensitive columns, such as those containing PII, HIPAA-related data, or GDPR-covered information. It also tracks metrics like the number of unique users who accessed sensitive data over the last 7 days.
One of the most effective ways to use this feature is by pairing data classification results with Attribute-Based Access Control (ABAC). For instance, once a column is identified as sensitive, you can create policies to automatically mask it for users who shouldn’t have access to raw data. This approach ensures sensitive data is not just protected in theory but actively verified in practice. Additionally, lineage tables maintain a rolling 1-year history of data flow, giving you a clear view of where sensitive data moves and whether it’s being accessed inappropriately.
Integrating Databricks Security with Cloud and Enterprise Tools
Using the native monitoring features from Lakehouse Monitoring as a foundation, you can enhance your security setup by connecting Databricks security signals with external tools like cloud services, SIEM, and SOAR platforms.
Exporting and Ingesting Databricks Logs
Databricks makes it easy to export audit logs in JSON format directly to an Amazon S3 bucket. To set this up, you’ll need to configure an S3 bucket, assign the appropriate IAM role and credentials, update bucket policies, and use the Log Delivery API to send the logs in JSON format.
The logs follow a consistent path structure:
<bucket-name>/<delivery-path-prefix>/workspaceId=<workspaceId>/date=<yyyy-mm-dd>/auditlogs_<internal-id>.json.
The first log delivery may take up to an hour, but after that, new events typically show up every 15 minutes. If you plan to bring cloud-native logs like AWS CloudTrail or VPC Flow logs back into Databricks for analysis, use Auto Loader in file notification mode (via SQS). This method avoids the delays caused by scanning S3 directories. Since audit logs often include sensitive information, make sure the S3 bucket is protected with server-side encryption and strict bucket policies.
Correlating Databricks Events with Cloud Logs
The value of Databricks audit logs increases when paired with cloud-native logs. For example, integrating with AWS CloudTrail allows you to confirm that S3 access and IAM role activities align with Databricks user actions. Similarly, VPC Flow Logs can reveal unusual network behaviors, such as unauthorized access attempts or unexpected data egress.
For network-related events, Databricks provides two dedicated system tables:
system.access.outbound_network(blocked egress)system.access.inbound_network(blocked ingress)
To streamline analysis, normalize these logs using open schema models like OCSF (Open Cybersecurity Schema Framework), ECS (Elastic Common Schema), or CIM. A medallion architecture can help manage this process at scale:
- Bronze tables store raw logs.
- Silver tables handle normalization.
- Gold tables surface enriched, actionable alerts for further analysis.
Integrating with SIEM and SOAR Platforms
Normalized and enriched logs can be routed to SIEM platforms like Splunk or Microsoft Sentinel, where only high-confidence alerts are sent to reduce the workload on analysts. These alerts can also integrate with tools like Jira or ServiceNow for streamlined incident management.
Databricks Lakehouse serves as the central hub for processing large volumes of telemetry, ensuring that downstream systems only receive refined, actionable insights. For authentication, use OAuth machine-to-machine (M2M) credentials with a Databricks service principal instead of personal access tokens. To maintain security, grant access to system tables using specific GRANT SELECT statements for individual schemas like system.access or system.compute, rather than granting broad access to the entire catalog.
If your infrastructure spans multiple clouds, federated queries can help by keeping security data within its original region. This minimizes egress costs by transferring only filtered query results to the central SIEM.
"More than three quarters of all enterprises have infrastructure in multiple clouds." - Databricks Blog
In today’s multi-cloud environments, having a centralized and schema-normalized integration strategy is crucial for maintaining consistent visibility across your systems.
Running Security Monitoring and Incident Response
Databricks Lakehouse Security Monitoring: Incident Response Playbook
Turn your centralized, normalized logs into actionable insights by creating detection rules and developing a clear incident response plan.
Creating Detection Rules and Baselines
The system.access.audit table is a powerful tool for capturing key events like authentication attempts, data access, and administrative actions. This data helps identify unusual or suspicious activity.
Set up event-based rules for immediate threats, such as single sign-on (SSO) changes or account deletions, monitored over a 24-hour period. For longer-term patterns, use behavioral rules to detect anomalies like session hijacking or unexpected data transfers over a 30-day window.
"In order to align to the 'Never Trust, Always Verify' principle, we're going to have to be more proactive than that [monitoring only during incidents]." - Databricks Blog
Threshold-based rules can also be effective. For example, flag a high volume of delete events or permission changes occurring within a 60-minute window. Enhance these rules with external data sources like GeoIP datasets to detect logins from unusual locations or HR system feeds to identify activity from employees who are on leave. Use Delta Live Tables (DLT) to process only new data incrementally, ensuring efficiency.
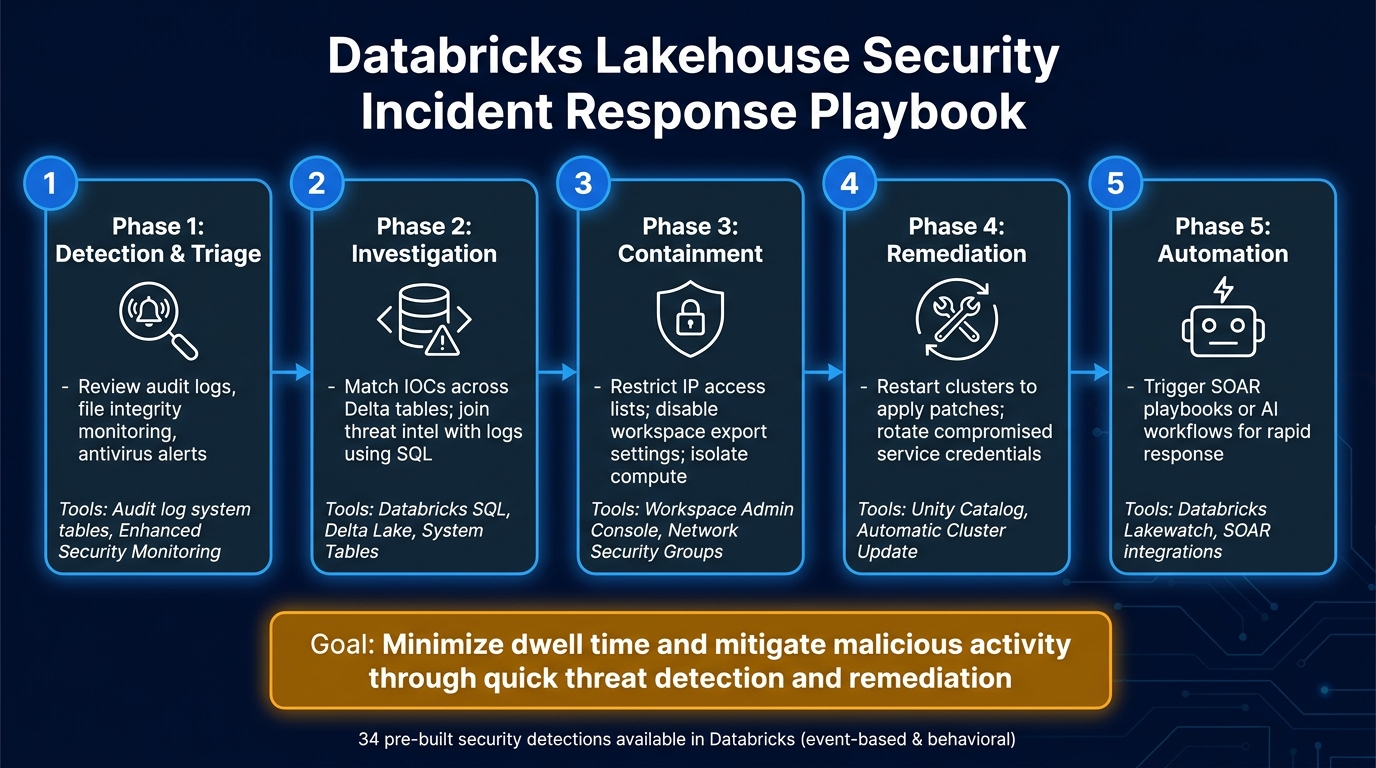
For convenience, Databricks offers 34 pre-built security detections, divided into event-based and behavioral categories, providing a strong foundation without requiring you to start from scratch.
Once detection rules are in place, it's essential to establish a structured response process to address threats effectively.
Building an Incident Response Playbook
A well-defined playbook can streamline your response during incidents. Here’s a breakdown of key phases and actions:
| Phase | Actions | Tools/Data Sources |
|---|---|---|
| Detection & Triage | Review audit logs, file integrity monitoring, and antivirus alerts | Audit log system tables, Enhanced Security Monitoring |
| Investigation | Match IOCs across Delta tables; join threat intel with logs using SQL | Databricks SQL, Delta Lake, System Tables |
| Containment | Restrict IP access lists; disable workspace export settings; isolate compute | Workspace Admin Console, Network Security Groups |
| Remediation | Restart clusters to apply patches; rotate compromised service credentials | Unity Catalog, Automatic Cluster Update |
| Automation | Trigger SOAR playbooks or AI workflows for rapid response | Databricks Lakewatch, SOAR integrations |
During investigations, use functions like regexp_extract_all() to scan logs for Indicators of Compromise (IOCs) such as malicious IPs or file hashes. For containment, platform-level fixes like patching hardened images may require opening a support ticket with Databricks.
"Quick threat detection and remediation for defensive operations is key to minimizing dwell time and mitigating malicious activity." - Databricks Blog
Setting Up Security Dashboards
Dashboards are essential for monitoring and responding to threats. Use a Quickstart notebook to schedule SQL queries that run against system.access.audit and deliver alerts for specific threat scenarios. Notifications can be sent directly to tools like Slack, Microsoft Teams, or PagerDuty.
For efficient analysis, create aggregated summary tables as materialized views using DLT. These tables can compress network logs by at least 10x, making historical searches fast and interactive during investigations. Structure your dashboards around specific threat scenarios like Account Takeover, Data Exfiltration, and Insider Threat to provide analysts with immediate context instead of overwhelming them with raw data. If you’re leveraging the Enhanced Security and Compliance add-on, include metrics for File Integrity Monitoring (FIM) and antivirus findings alongside standard audit log data.
Improving Security Monitoring Over Time
Building on established monitoring practices is essential to keep up with evolving threats and the ever-changing risk landscape. By refining your approach over time, you can ensure your security measures remain effective and aligned with current challenges.
Aligning Monitoring with Governance Frameworks
Databricks provides tools to help you align your monitoring practices with specific regulatory frameworks. Account administrators can select compliance standards such as HIPAA, PCI-DSS, FedRAMP Moderate, or FedRAMP High directly within the Databricks account console. Once selected, these standards automatically enforce key controls, including FIPS 140 validated encryption and CIS Level 1 hardened images across all workspaces.
It’s important to note that enabling a compliance configuration is a permanent decision. Once regulated data is processed under a specific framework, the configuration cannot be removed. This makes it critical to carefully plan your compliance settings before activation.
For organizations operating under GDPR, Databricks offers tools like Unity Catalog's lineage tracking and Lakehouse Federation. These ensure that queries remain within the original region, maintaining data residency without requiring replication.
Running Periodic Security Reviews
"A chain is as strong as its weakest link... security teams may not re-assess and configuration drift could inadvertently lead to data and intellectual property breaches." - Databricks Blog
Configuration drift is one of the most common threats to security. To mitigate this risk, run the Security Analysis Tool (SAT) daily and compare scan results to quickly detect any changes. Additionally, restarting clusters every two weeks ensures that the latest patched host VM images and updated monitoring agents are applied.
Workspace admins receive regular vulnerability scan reports via email, which include details on known CVEs. Reviewing these reports should be a routine part of your security operations calendar. While regular reviews strengthen your defenses, it’s equally important to enhance your team’s expertise to stay ahead of emerging threats.
Building Team Skills and Maturity
Strengthening your team’s skills is key to improving your security monitoring program. Focus on areas like SQL proficiency, understanding the Unity Catalog object model, and practicing detection engineering using system logs. These skills are critical for effectively leveraging the monitoring and incident response tools discussed in this guide.
As your program evolves, consider incorporating AI-driven investigation techniques. For example, use notebooks for advanced threat hunting or build User and Entity Behavior Analytics (UEBA) on top of your existing log pipelines.
For structured training, DataExpert.io Academy offers hands-on Databricks boot camps and subscriptions covering data engineering and governance topics. Databricks also provides its own Data Governance at Scale course, a 4-hour program designed to enhance knowledge on Unity Catalog, ABAC, system tables, and Delta Sharing. These resources can help your team stay equipped to handle today’s security challenges.
FAQs
What should I monitor first in Databricks for the biggest risk reduction?
To effectively minimize risks, begin by keeping a close eye on user authentication and data access patterns using the system.access.audit table. Pay particular attention to signs of account compromise, such as multiple failed login attempts, unauthorized access to Unity Catalog, or unusual changes to permissions. These types of activities are often red flags for potential data breaches. For practical training on security workflows, consider exploring programs offered by DataExpert.io Academy, which cover tools like Databricks.
How do I connect Databricks audit logs with my cloud logs for full visibility?
To connect Databricks audit logs with your cloud logging systems, you can use the system.access.audit table. This table provides centralized access to platform events, eliminating the need for manual ETL pipelines.
Alternatively, you can set up audit log delivery to cloud storage, such as Amazon S3, using Databricks APIs. If you're working in Azure, you can take advantage of diagnostic settings to stream logs directly into Azure Log Analytics, enabling unified monitoring alongside other cloud telemetry.
What’s the best way to turn system table logs into real alerts and incident workflows?
To stay on top of security events, Databricks SQL alerts are a great tool. You can write SQL queries targeting the system.access.audit table and set them to run automatically. When specific conditions are met, these alerts will trigger notifications, keeping you informed.
Want to streamline your workflows? You can integrate SQL alerts as tasks within Lakeflow Jobs. For a quicker implementation, consider cloning open-source repositories. These often come with pre-configured SQL queries and alerts tailored for common security events, saving you time and effort.