
Scaling Self-Service Analytics with Databricks
Self-service analytics only works when every team sees the same numbers. If revenue, churn, or pipeline changes from one dashboard to another, people stop trusting the data fast.
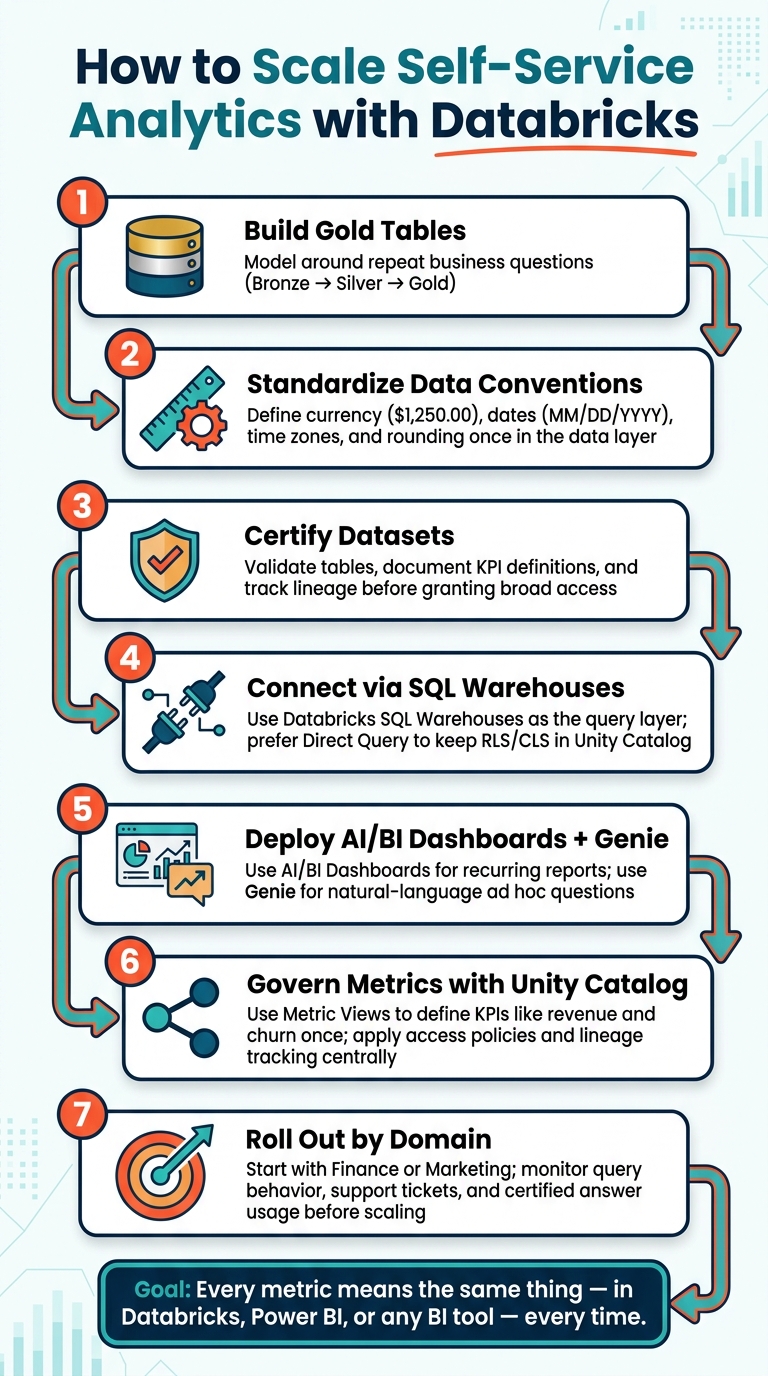
I’d sum up the article like this: Databricks helps me scale self-service analytics by putting data models, shared metrics, and access rules in one place. The path is simple: build Gold tables around repeat business questions, standardize business rules in the data layer, connect BI tools through Databricks SQL Warehouses, and use Unity Catalog to keep metric definitions and access policies consistent.
Here’s the short version:
- I build Gold tables for common business questions, not just cleaned-up source data.
- I define U.S. data rules once, like $1,250.00, 07/27/2026, and fixed time zone handling.
- I certify datasets before broad access, with validation, KPI definitions, and lineage.
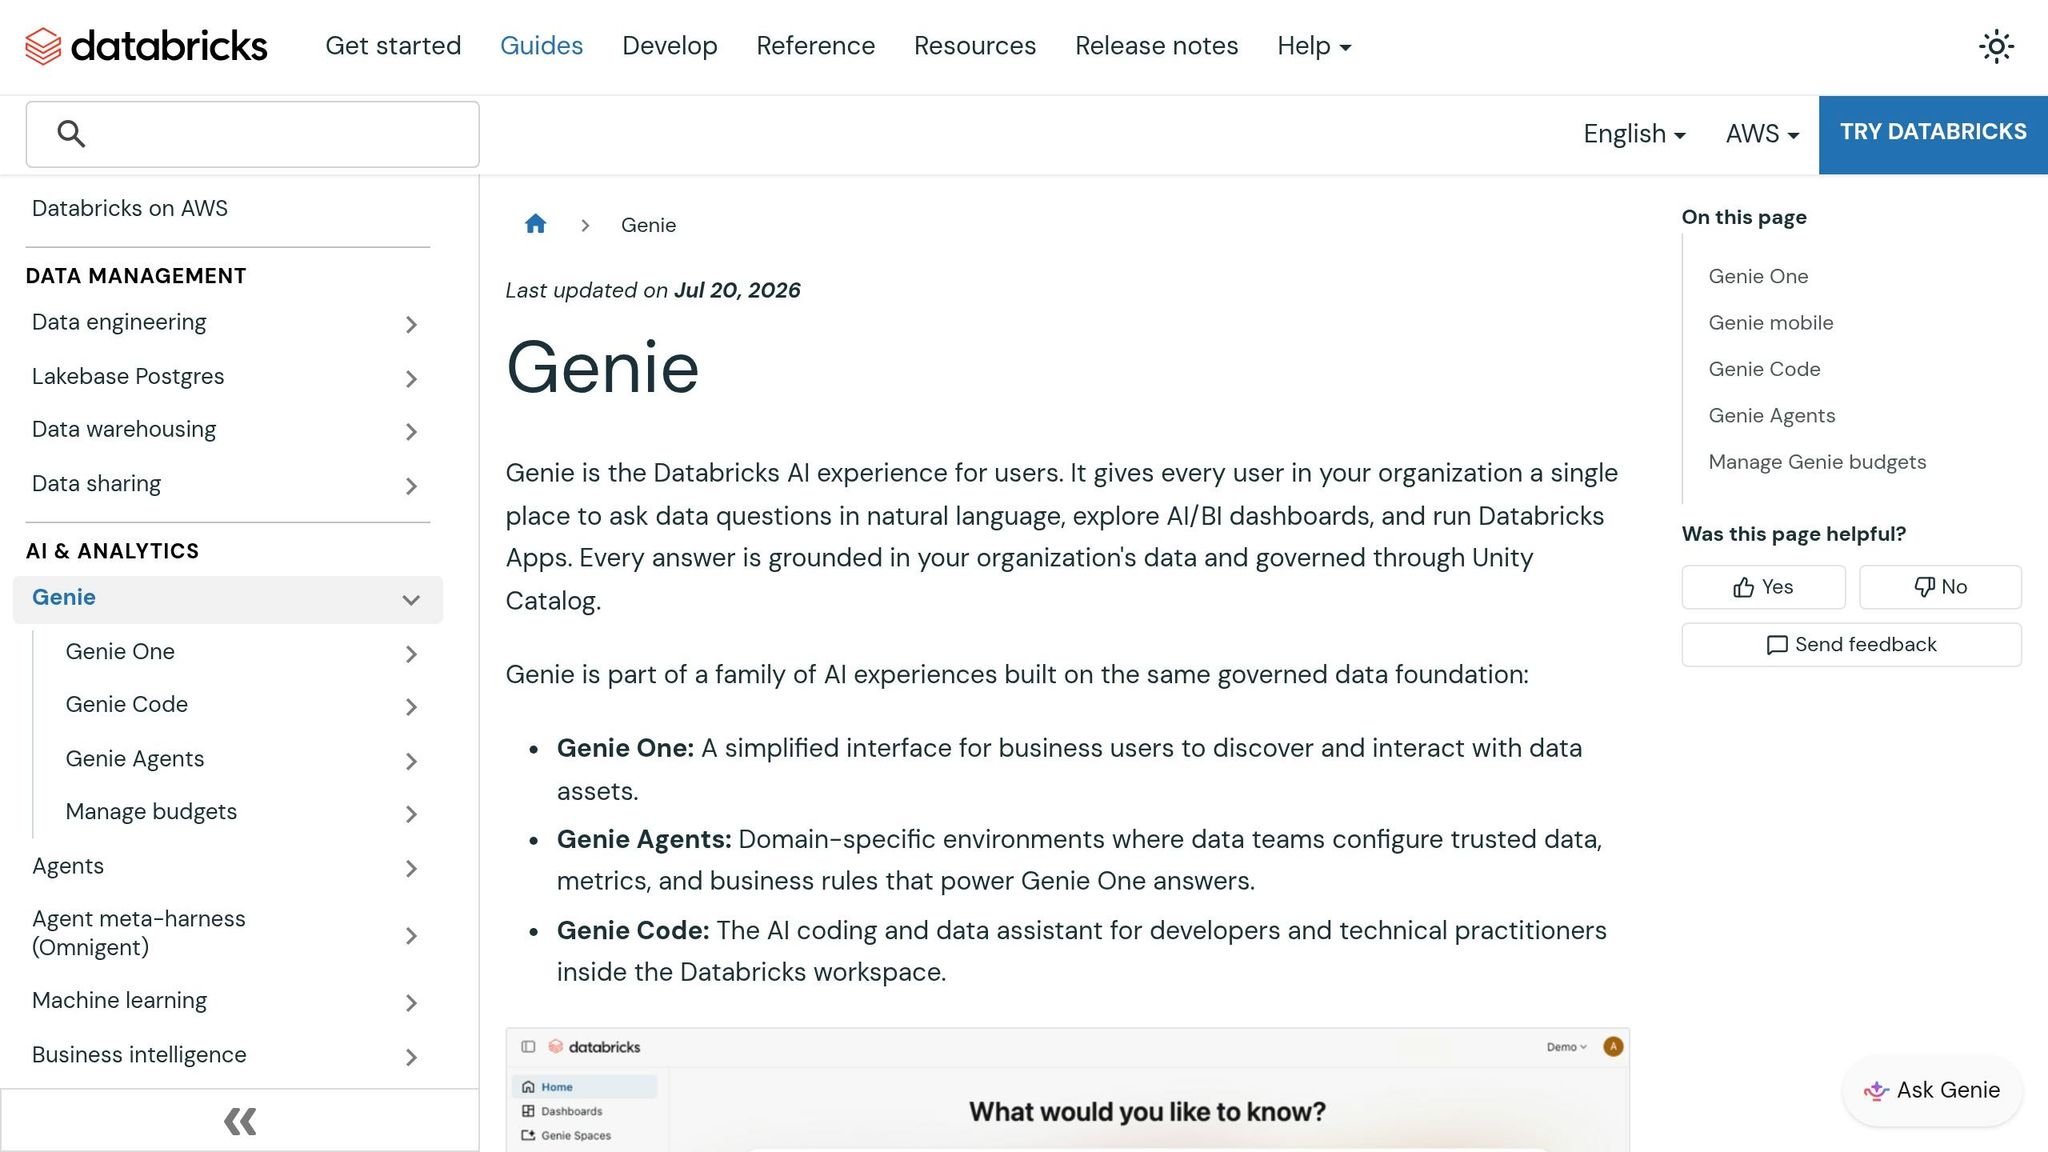
- I use Databricks AI/BI Dashboards for repeat reporting and Genie for natural-language questions.
- I connect external BI tools through Databricks SQL Warehouses so row-level and column-level controls stay in place.
- I use Unity Catalog Metric Views so teams don’t create different versions of the same KPI.
- I roll this out by domain, track usage, and train users on both metrics and governance through analytics excellence programs.
A few points stand out. First, the article makes clear that static dashboards often fail when users need follow-up answers. Second, it shows why Direct Query is often the safer choice when security rules must stay in Databricks. Third, it treats trust as the main goal: if even a 2.00% mismatch shows up between reports, people go back to spreadsheets and side files.
How to Scale Self-Service Analytics with Databricks
How We Turned 200+ Business Users Into Analysts With AI/BI Genie
sbb-itb-61a6e59
Quick comparison
| Area | What I focus on | Why it matters |
|---|---|---|
| Data model | Gold tables built around repeat questions | Users get answers that match business use |
| Standards | Currency, dates, time zones, rounding in the data layer | Teams stop seeing small number differences |
| Dataset release | Certification with lineage and KPI docs | People know what they are using |
| Dashboards and Q&A | AI/BI Dashboards + Genie | Covers both repeat reporting and ad hoc questions |
| BI access | Databricks SQL Warehouses | Keeps access rules in one place |
| Shared metrics | Unity Catalog Metric Views | Cuts KPI drift across tools |
| Rollout | Start with one domain, then expand | Makes adoption easier to track and fix |
My takeaway: this is not just about giving people a dashboard. It’s about making sure the same metric means the same thing everywhere, every time, whether someone checks it in Databricks, Power BI, or another BI tool.
That’s the core idea behind the rest of the article.
Build the Foundation: Lakehouse Data Models and Certified Datasets
Dashboards only work when the layer underneath them is solid. That layer is your data model: curated Gold tables that business users can rely on. When Gold tables are certified, self-service gets a lot easier. People can answer their own questions without metric drift or waiting on analysts every time. The key is simple: model Gold around repeat business questions, not around source-system tables.
Design Gold Tables Around Common Business Questions
The medallion architecture gives teams a clean path: Bronze for raw ingestion, Silver for reconciled source data, and Gold for business-ready outputs. A common miss is treating Gold like a tidier version of Silver. It’s not.
Gold should be shaped around the questions people ask all the time. Think of the requests that show up week after week. Those are the ones your model should support first. As Gold tables get larger, use Z-ordering on common filter columns and MERGE operations for incremental updates. For changing master data, use SCD Type 2 so users can report on past states without losing the current one.
Once the model is in place, the next job is consistency. Every dashboard should show the same number for the same metric.
Standardize U.S. Business Conventions in the Data Layer
Put standard rules in the data layer, not inside each dashboard. Define them once in Gold tables and views so every connected tool returns the same output.
| Convention | Standard to Apply |
|---|---|
| Currency | USD, formatted with a dollar sign and 2 decimal places (e.g., $1,250.00) |
| Date display | MM/DD/YYYY (e.g., 07/27/2026) |
| Time handling | Store and display an explicit time zone - ET or PT depending on business context |
| Number formatting | Comma as thousands separator, period as decimal (e.g., 1,000,000.50) |
| Rounding | Two-decimal rounding applied at the Gold layer, not in BI tools |
This matters more than teams expect. If one dashboard rounds at the chart level and another rounds in SQL, you end up with small mismatches that turn into big trust problems.
Certify Datasets Before Opening Them to Self-Service
A dataset isn’t ready for broad use just because it lives in Gold. Certification means the table has passed validation, includes documented KPI definitions, and has lineage before self-service access. If a Gold table no longer answers a business question, remove it so you’re not carrying extra maintenance work.
Unity Catalog lineage shows where the data came from, which helps people trust what they’re looking at. After certification, these datasets are ready for BI tools and AI/BI without extra rework.
Connect Databricks to BI Tools and Databricks AI/BI
Certified Gold tables only help if people can get to them in the tools they already use. That’s where Databricks SQL Warehouses come in. They act as the main query layer, so teams can query governed data right inside Databricks. The same governed layer can support both polished dashboards and open-ended analysis.
Use Databricks AI/BI for Native Dashboards and Natural Language Queries
Databricks AI/BI includes two separate experiences: AI/BI Dashboards for recurring business questions, and Genie for conversational access to data. AI/BI uses platform metadata, lineage, and query history to improve answers. Genie gets better through user feedback and returns trusted answers to common questions.
In practice, both Genie and dashboards work best when they sit on certified Gold tables with steady metric definitions. If the source layer is messy, the answers will be messy too. Recent updates to AI/BI Dashboards, such as cross-filtering, static widget parameters, and query-based parameters, also make it easier for users to dig into data without leaving the dashboard.
Connect External BI Tools Through Databricks SQL Warehouses
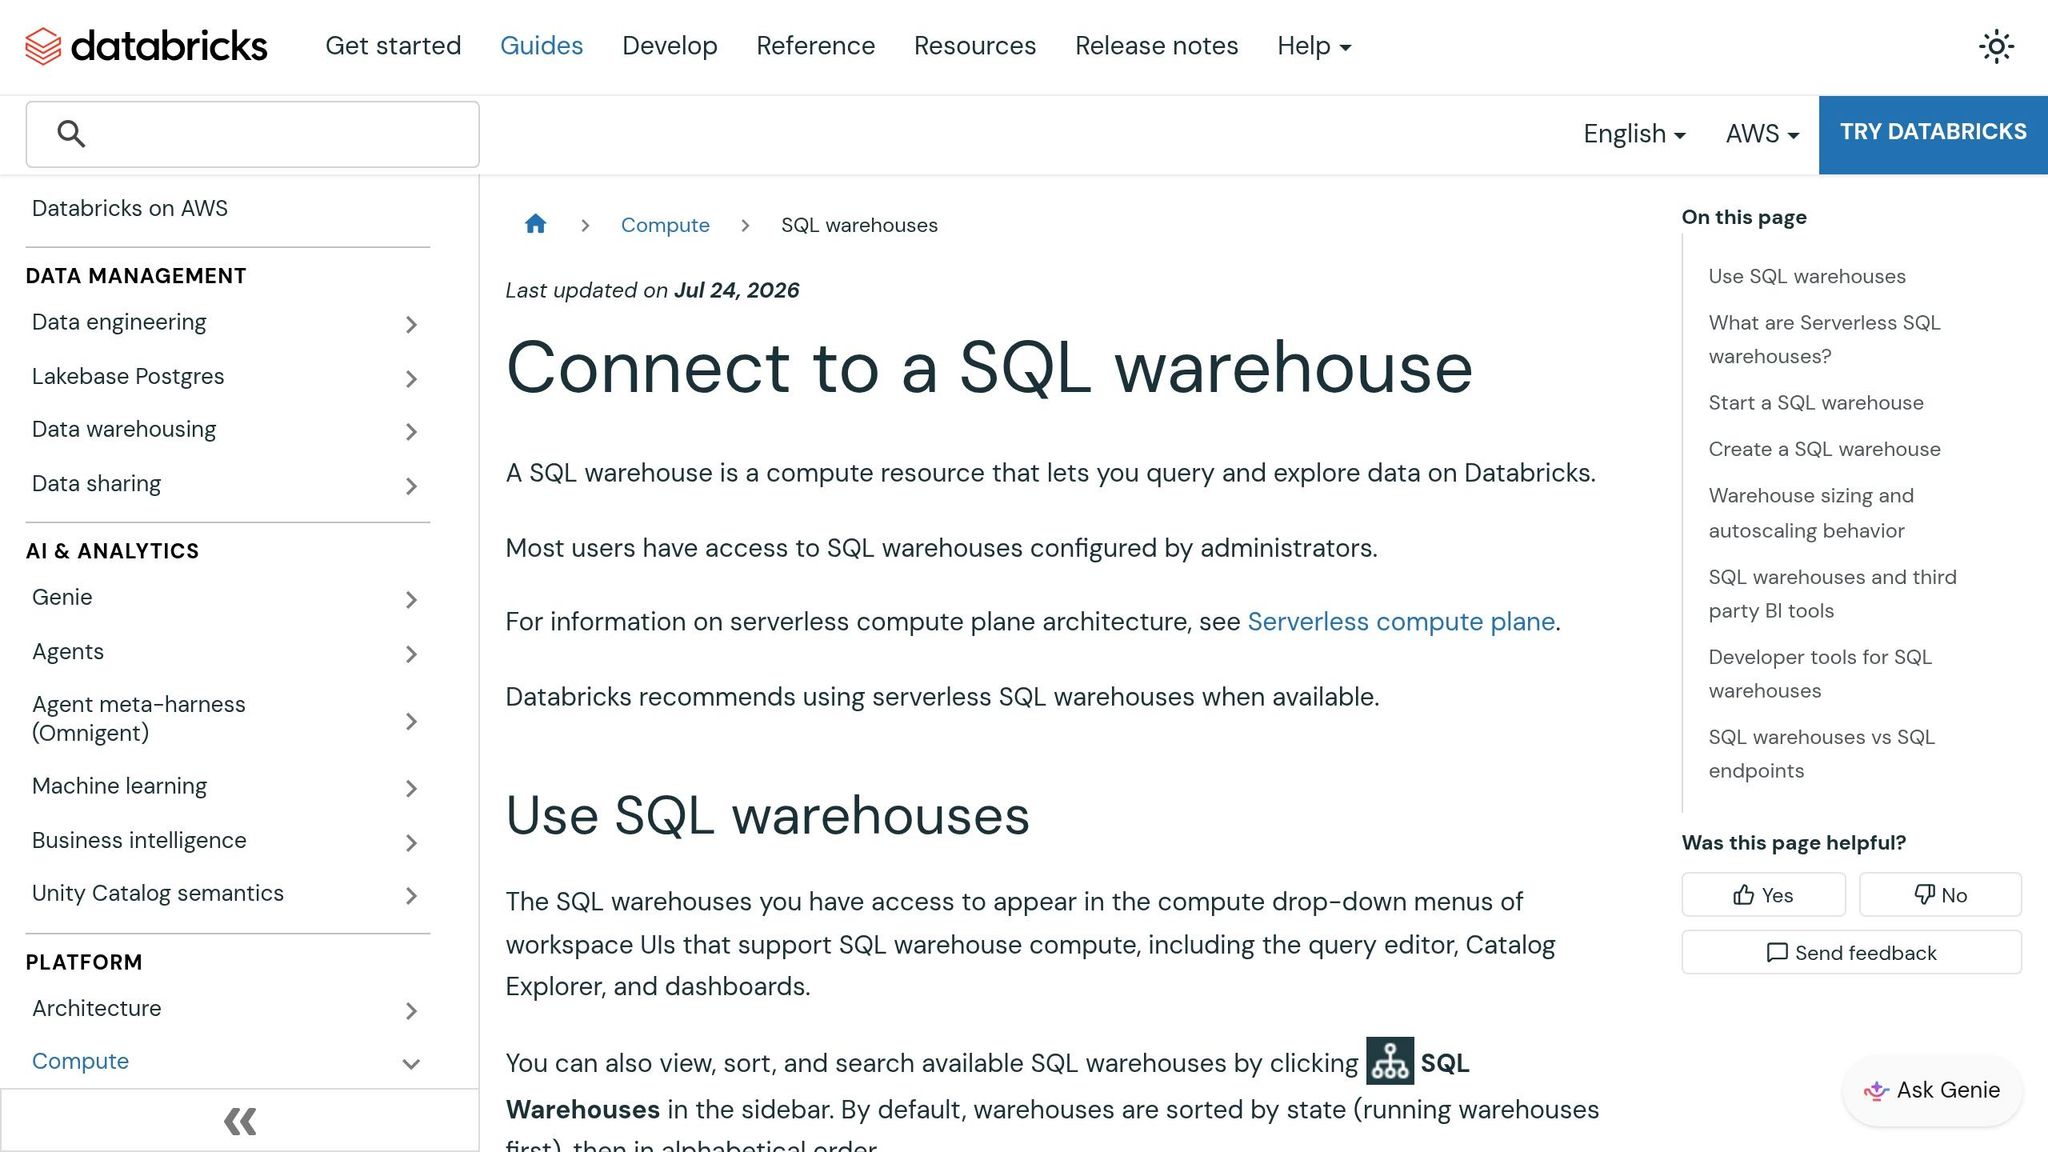
If your team already works in outside BI tools, Databricks SQL Warehouses should be the access point. Instead of copying data into another engine, the BI tool queries Databricks directly. That matters because Unity Catalog still controls row-level security, column-level security, and data masking at the warehouse level, no matter which tool sends the query. The same Unity Catalog policies stay in force whether someone uses Databricks AI/BI or a connected BI tool.
A simple rule of thumb:
- Use Direct Query when access control or masking needs to stay in Databricks.
- Use Import Mode only for small models with limited security needs.
| Method | Governance | Data Freshness | Performance | Maintenance |
|---|---|---|---|---|
| Direct Query (Databricks SQL) | Centralized in Unity Catalog; RLS/CLS applied in real time | Real-time | Scalable via Serverless SQL Warehouses | Low |
| Scheduled Extracts (Import Mode) | Fragmented; security must be re-applied in the BI tool | Delayed by refresh schedule | Fast for small data; limited by in-memory capacity | High |
Roll Out in Phases
Rollout should follow what users need, not which product a team likes more. Keep critical, complex reports in the BI tools your teams already depend on, while introducing AI/BI Dashboards for simpler, high-visibility reports. Then use Genie Spaces for ad hoc questions from people who want room to explore without writing SQL.
Build a Governed Semantic Layer with Unity Catalog
Even certified Gold tables can drift when teams define metrics in different ways. So certification alone doesn't solve the whole problem. The missing piece is a shared, governed way to define metrics once and use them everywhere.
That’s where a governed semantic layer comes in.
Unity Catalog is the backbone here. It acts as a core governance layer for data and AI assets in Databricks. From there, metric definitions turn into reusable business logic that any tool or team can use without redefining them in a local dashboard, spreadsheet, or BI model. Metric Views are what make that possible in a governed way.
Define Shared Metrics Once and Reuse Them Across Tools
Databricks Unity Catalog supports Metric Views - first-class objects that define reusable, governed business metrics on top of existing tables and views. That means teams can define metrics like revenue or churn rate once, in one place, instead of rebuilding them over and over.
Why does that matter? Because metric drift often starts with small changes that seem harmless. One team excludes refunds. Another counts churn on a different date. Before long, the same KPI tells two different stories.
By centralizing those metrics in Unity Catalog, you cut down that drift and keep teams aligned on what each KPI means.
Apply Access Policies and Lineage Tracking Through Unity Catalog
Governance has to move with the metric itself. If it lives somewhere off to the side, people will work around it.
Unity Catalog centralizes access policies so they apply in a consistent way across the ecosystem. That helps teams control who can see what without setting rules again and again in each downstream tool.
Lineage tracking adds another layer of clarity. Users can see how data moves from raw tables into downstream analytics assets, which makes debugging less of a guessing game and helps with compliance reviews too.
Write Semantic Rules in Language Business Users Understand
A metric definition only works if people can read it and understand it fast.
Technical precision matters, of course. But on its own, it’s not enough. Business users need plain-language definitions that spell out what a metric means, what it includes, and how it should be used.
Those descriptions should live in Unity Catalog right alongside the data assets themselves. That way, people don’t have to hunt through docs or ask around in Slack just to figure out what a number means. They can interpret metrics the same way across tools, which is the whole point.
Operating Model, Adoption, and Skills for Long-Term Scale
Once the semantic layer is in place, the next hurdle is getting people to use it the right way, at scale. That’s where operating discipline starts to matter just as much as platform setup. A model doesn’t grow because the architecture looks good on paper. It grows when teams trust it, use it, and stop falling back to side routes.
This is also where many teams shift from a warehouse-first setup to a governed Lakehouse approach. The platform gets part of the job done. People and process handle the rest.
Roll Out by Domain, Not All at Once
Start where the pain is most obvious. Pick one domain and focus on a short list of high-value KPIs. Finance or Marketing often make good starting points because the outcomes are clear and easy to measure. Use the certified Gold layer as the rollout boundary.
Before you expand, watch three signals closely:
- Query behavior
- Support ticket trends
- Use of certified answers instead of ungoverned workarounds
If users keep going back to ungoverned workarounds, that’s a sign something still isn’t clicking. Usually, the issue is one of two things: the semantic definitions aren’t clear enough, or dataset discovery still feels too hard. Either way, fix that before you scale.
Train Users on Metrics, Tools, and Governance Expectations
Rollout doesn’t stick unless users know how to read, trust, and use governed data. Training should match the role. Engineers need to understand platform mechanics. Analysts need help with dataset discovery, metric definitions, and where to go when something looks off.
A practical setup is to run 1-hour awareness sessions for business stakeholders that cover AI/BI Genie spaces, dataset discovery, and metric definitions. Then follow with deeper, hands-on sessions for technical leads on Gold layer design, Unity Catalog governance, and escalation paths for metric disputes. It helps to ask everyone to use one idea right away in a current business use case.
For hands-on Databricks training, DataExpert.io Academy offers boot camps and project-based learning.
Conclusion: What Scalable Self-Service Analytics Requires
With the right rollout and training model, Databricks self-service becomes repeatable instead of fragile. Scale comes from shared metrics, governed access, and role-based adoption.
FAQs
Why aren’t Silver tables enough for self-service analytics?
Silver tables give you clean, dependable data. But on their own, they usually don’t include the business rules, rollups, or query tuning that end users need.
Gold tables take that Silver data and shape it into a business-ready layer. This is where teams add actionable insights, model predictions, and trusted metrics so self-service analytics becomes much easier for non-technical users to work with.
When should I use Direct Query instead of Import Mode?
Use Direct Query when your dataset is too large to fit into memory or when access rules must stay in Databricks itself. That includes cases like row-level security, object-level security, and data masking.
Import Mode is a good fit for smaller, simpler models. But if you need near real-time access, Direct Query is usually the better choice. It also lets you use Databricks’ elastic compute instead of relying on an outside in-memory engine.
How do Metric Views reduce KPI mismatches across teams?
Metric Views cut KPI mismatches by giving teams one governed semantic layer inside Databricks Unity Catalog. Instead of rebuilding metric logic in every BI tool or dataset, teams define each business metric once and use it everywhere.
That means metrics like revenue or churn come from a single source of truth. Dashboards stay aligned, and natural language interfaces return answers people can trust instead of conflicting numbers.