
Why dbt SQL Anti-Patterns Hurt Performance
SQL anti-patterns in dbt can silently degrade performance and inflate costs. Common issues include overly complex queries, redundant operations, and inefficient configurations. These mistakes often lead to slower run times, higher compute expenses, and even incorrect data outputs.
Key takeaways:
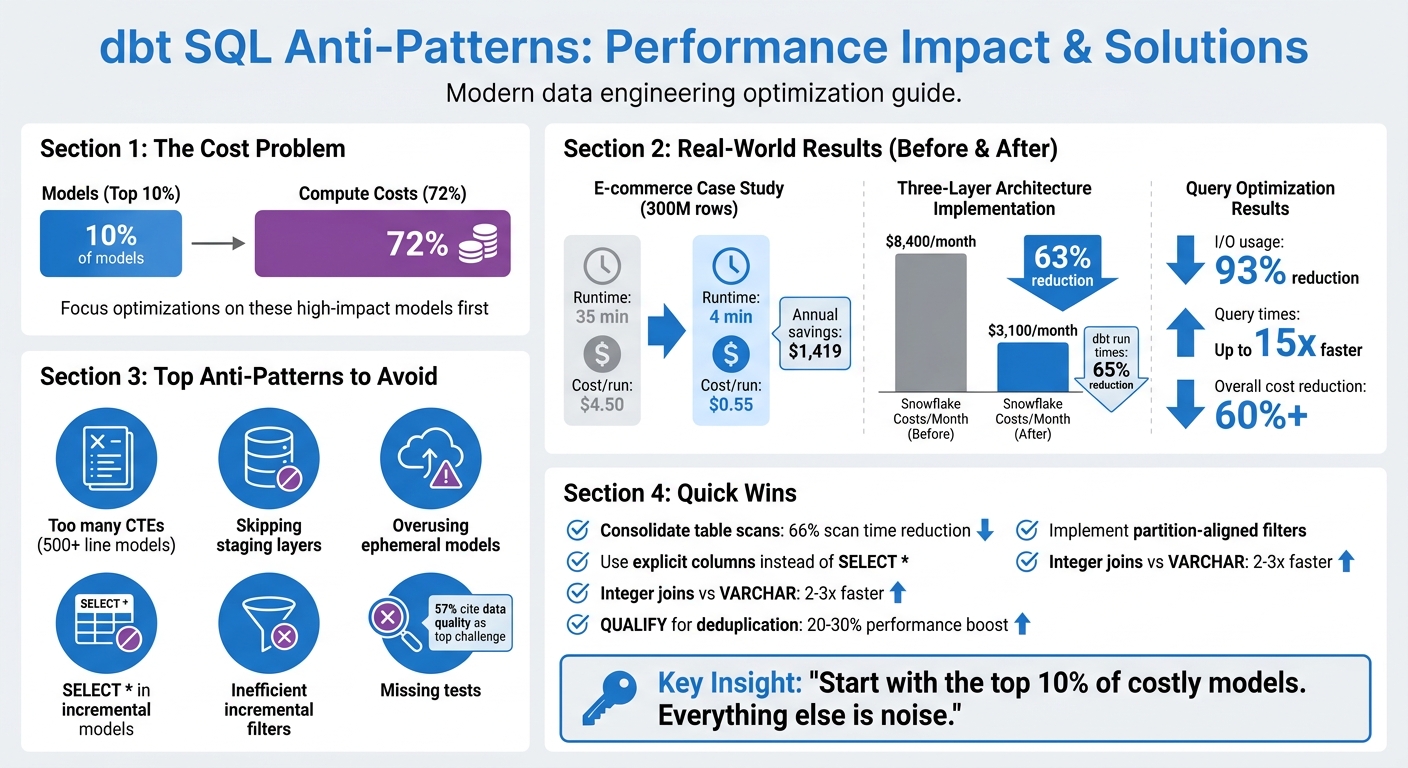
- 10% of models can drive 72% of compute costs. Focus optimizations here first.
- Large models with too many CTEs waste resources. Break them into smaller, reusable components.
- Skipping staging layers creates redundancy and complicates debugging. Always include staging for raw data.
- Overusing ephemeral models duplicates logic and increases query complexity. Materialize reusable models instead.
- Misconfigured incremental models often cause costly full table scans. Refine filters and align with partitions.
Practical fixes like using explicit columns, avoiding SELECT *, and implementing targeted filters can cut costs by over 60% and reduce run times by up to 15x. A three-layer architecture (staging, intermediate, marts) combined with proper testing ensures smoother workflows and reliable data.
dbt SQL Anti-Patterns: Performance Impact and Cost Savings
From slow to swift: Proven methods for optimizing your dbt project - Coalesce 2023
sbb-itb-61a6e59
Common dbt SQL Anti-Patterns That Slow Down Queries
As dbt projects grow, certain coding habits can creep in, leading to slower performance and higher costs. These anti-patterns may seem harmless at first but can cause headaches when model run times balloon or compute expenses skyrocket. Let’s dive into some common pitfalls and how to address them effectively.
Large Models with Too Many CTEs
SQL files that stretch over 500 lines and use dozens of nested CTEs can become a nightmare to debug. When errors pop up, dbt often points to the compiled SQL, not your original code, making troubleshooting a frustrating process. Plus, dbt can’t test intermediate steps hidden in CTEs, raising the risk of bad data slipping through undetected.
But the bigger issue lies in redundant table scans. When the same table is referenced in multiple CTEs, it can trigger repeated scans, wasting both compute resources and time. Consolidating these scans into a single CTE with multiple aggregations can slash scan time by up to 66%.
"If a CTE is logically reusable, it should be its own model." - Laxminarayana Likki, BI Consultant
The solution? Break large models into smaller, modular components. A three-layer architecture - staging (stg_), intermediate (int_), and final models (fct_/dim_) - makes data lineage clearer, simplifies debugging, and allows testing at every step. For example, in January 2026, an e-commerce company revamped their fct_customer_orders model, which handled 300 million rows. By switching from full table materialization to an incremental merge strategy, they cut runtime from 35 minutes to just 4 minutes and reduced the cost per run from $4.50 to $0.55. Over a year, this saved them $1,419.
Skipping the Staging Layer
Skipping the staging layer might seem like a shortcut, but it often leads to redundant transformations in downstream models. Without a staging layer, every model has to repeat basic tasks like renaming columns, casting data types, or cleaning values. This violates the DRY (Don’t Repeat Yourself) principle and wastes compute resources. It also makes tracking data lineage harder and complicates impact analysis when changes occur.
The fix? Create a staging model for every raw source table. Materialize these as views to keep storage usage low while ensuring downstream models always pull fresh data. Keep staging transformations simple - focus on renaming, type casting, and basic computations like converting cents to dollars. Save joins and aggregations for the intermediate layer.
"Staging models help us keep our code DRY... This saves us from potentially wasting code, complexity, and compute doing the same transformation more than once." - dbt Developer Hub
One team that adopted this three-layer approach saw dramatic results: their Snowflake costs dropped by 63%, from $8,400 to $3,100 per month, and total dbt run times fell by 65%.
Overusing Ephemeral Models
Ephemeral models may seem convenient, but they can cause performance issues when overused. These models inline their SQL, meaning the same code is duplicated every time they’re referenced. If 10 models reference the same ephemeral model, the SQL is duplicated 10 times, increasing query complexity and execution time.
This duplication also makes it harder to track compute costs, as ephemeral models don’t show up in query logs. Additionally, you can’t run data quality tests on them, and deeply nested ephemeral models can create massive, unoptimized queries that strain your data warehouse.
A better strategy is to materialize commonly used models as tables or incrementals. This makes compute costs visible, allows for testing, and avoids re-executing the same logic across multiple queries. Reserve ephemeral models for simple, one-off logic that doesn’t require testing or reuse. These changes can make your dbt projects more efficient and easier to manage.
Performance Problems in Incremental Models
Incremental models are designed to process only updated or new data, but misconfigurations can lead to full table scans, unnecessarily inflating costs and processing time. To keep dbt models running efficiently, it's crucial to refine filter logic and avoid common SQL pitfalls. Let’s break down two major issues that can derail incremental model performance.
Inefficient Incremental Filters and Full Table Scans
When filters aren’t properly aligned with partitions, platforms like Snowflake are forced into full table scans. For example, using filters like WHERE status = 'PENDING' instead of date-based conditions prevents partition pruning, requiring the system to scan every micro-partition to find relevant rows.
During a merge operation, dbt scans the entire destination table to match unique keys unless you configure incremental_predicates to limit the scan to specific partitions. This inefficiency causes costs and runtimes to scale with the total table size rather than just the new data. For instance, what should cost $0.55 per run may balloon to $4.50 due to these missteps.
"The config is the easy part. The logic matters more. It requires four components working together. Miss any one of them and you're paying for full table scans while thinking you're optimized."
– Blake Lassiter, Principal Data Architect
To avoid this, always pair the is_incremental() macro with partition- or cluster-aligned columns. Use lookback windows with a buffer (e.g., dateadd(day, -3, max(order_date))) to account for late-arriving data, and for tables exceeding 100 million rows, configure incremental_predicates to limit scans during merges. Monitoring query history for bytes_scanned is another way to ensure partitions are being pruned effectively - if scans match the total table size, the model isn’t working as intended.
| Strategy | Best Use Case | Performance Note |
|---|---|---|
| Merge | Small-to-medium tables with row updates | Struggles with tables >100M rows without predicates |
| Delete+Insert | Large Snowflake tables (500M+ rows) | 3.4x faster than merge but lacks atomicity |
| Insert_Overwrite | Time-partitioned fact tables (BigQuery) | Efficient for BigQuery; replaces entire table on Snowflake |
| Append | Append-only event data | Most cost-effective; avoids updates and scans |
While filter inefficiencies are a major issue, another common trap lies in using SELECT * and hardcoded values.
SELECT * and Hardcoded Values
Using SELECT * can silently cause data loss when new columns are added to the source system. The model won’t error out but may fail to capture these new columns for historical records. This creates a "split table" effect, where older rows are incomplete while newer rows are accurate - a problem that only worsens over time.
Hardcoded lookback windows, such as INTERVAL '3 days', introduce another layer of fragility. Late-arriving data outside the hardcoded window gets filtered out, potentially leading to permanent data gaps. Additionally, hardcoded values make it difficult to adapt models for different environments like development, testing, and production.
"The worst data bugs are the ones you discover too late."
– Darshan Pathak
To mitigate these risks, explicitly select columns instead of relying on SELECT *. This not only prevents missing data but also reduces unnecessary overhead. Use on_schema_change='fail' to make schema changes more visible or sync_all_columns to automatically incorporate new columns into the target table. Replace hardcoded lookback windows with dbt variables (e.g., var('lookback_days', 3)) for flexibility. Additionally, schedule periodic full refreshes (weekly or monthly) to address any data drift caused by late-arriving records.
Better Testing and Code Quality in dbt Projects
Keeping your dbt projects running smoothly isn’t just about writing efficient queries - it’s also about prioritizing solid testing and maintaining clean, consistent code through advanced data engineering practices. Testing and linting play a crucial role here. They help catch bugs early and ensure you don’t end up with performance issues caused by things like duplicate records or missed incremental updates. In fact, a survey from 2024 revealed that 57% of analytics engineers see data quality as one of their biggest day-to-day challenges. Without proper testing, small errors can snowball over time, leading to inaccurate metrics and dashboards.
Missing Tests and No Linting
Skipping tests can have serious consequences. For example, a simple lookup table rebuild that should take seconds can stretch to 45 minutes, or worse, result in missing data that throws off downstream analysis. On top of that, inconsistent SQL styles and syntax errors can make your code a nightmare to manage. Without tools like SQLFluff to enforce consistency, you could end up in what Jim Collins from MetaOps calls "model dependency hell".
So, how do you address these issues? Start by introducing unique and not_null tests for every primary key. This simple step can prevent join explosions that slow down query processing times. To ensure team-wide consistency, configure SQLFluff with a centralized .sqlfluff file and use a .sqlfluffignore file to exclude irrelevant directories like target/ and dbt_packages/ - this speeds up linting and keeps the focus on critical areas.
Another key strategy is setting severity thresholds to prioritize alerts. Use severity: error for critical issues, such as those affecting customer-facing or financial data, and severity: warn for less urgent anomalies. As Faith and Jerrie from dbt Labs Training and Services explain:
"Data testing should drive action. The more alerts you have in your pipeline, the less action you will take".
One team that adopted a "Boring But Correct" testing approach paired with efficient materialization strategies managed to cut their Snowflake compute costs by 63% - a clear example of how better testing can directly impact costs.
For large datasets, avoid expensive full-table scans by using filtered tests with a WHERE clause (e.g., testing only the last 30 days). Automating linting with GitHub Actions or GitLab CI ensures that every pull request meets your quality standards without extra manual effort. The key isn’t having more tests but having well-placed tests with clear ownership and appropriate severity levels. By focusing on targeted testing and automation, you can improve performance while laying the groundwork for long-term success in your dbt projects.
Conclusion
Tackling SQL anti-patterns in your dbt projects isn't just about improving query performance - it's about creating a reliable, scalable data platform that stakeholders can depend on. When incremental models trigger full table scans or joins break due to mismatched data types, you're not only burning through compute resources but also putting the accuracy of downstream metrics at risk. These issues often go unnoticed, which makes them even riskier as your project grows.
To make a real impact, focus your optimizations where they count. Start with the 10% of models responsible for the bulk of your costs. As Abhishek Kumar Gupta puts it:
"If you want to cut costs, start with the top 10%. Everything else is noise".
Simple adjustments can deliver big results. Audit your incremental models, apply filters early in your CTEs, and stick to explicit column lists. These tweaks alone can slash I/O usage by 93% and reduce query times by up to 15x.
Streamlining your architecture is equally important. Use a three-layer structure - staging, intermediate, and marts - to speed up development and master data engineering to make onboarding easier. Combine this with thorough testing that goes beyond basic schema checks to catch silent errors before they escalate. For example, integer-based joins on large tables can be 2–3x faster than VARCHAR joins, and leveraging platform-specific tools like QUALIFY for deduplication can improve performance by 20–30%.
FAQs
How do I find the few dbt models driving most of my compute cost?
To pinpoint which dbt models are responsible for most of your compute costs, check out the Cost Insights feature in your project dashboard. This tool breaks down estimated costs and compute times for each model. Pay close attention to the top 20% of models that account for 80% of resource usage. Additionally, using query tags in Snowflake can help you tie costs directly to specific models or runs, offering a clearer view of what's driving expenses.
When should I materialize a model instead of using ephemeral?
When performance is a priority - like with frequently accessed or compute-heavy transformations - or when you need to save transformation results for quicker querying, materializing a model is the way to go. On the other hand, ephemeral models work best for modular SQL workflows where creating physical tables or views isn’t necessary. By choosing materialization, you can streamline performance and cut down on computation overhead for more complex queries.
How can I confirm my incremental model is avoiding full table scans?
To make sure your incremental model skips full table scans, it's important to use the is_incremental() macro in your SQL. This macro, paired with a filter like WHERE, ensures that only new or updated data gets processed. Here's an example:
{% if is_incremental() %}
  WHERE updated_at > (SELECT MAX(updated_at) FROM {{ this }})
{% endif %}
Additionally, check that your model is set up with materialized='incremental'. Don't forget to test the generated SQL to confirm that the filtering is working as expected.