
Snowflake vs. Databricks: Monitoring Features Compared
If you want low-touch SQL warehouse monitoring, I’d pick Snowflake. If you need one place to watch SQL, Spark jobs, and streaming, I’d lean toward Databricks.
Here’s the short version:
-
Snowflake is stronger for:
- credit-based spend controls
- warehouse auto-suspend and auto-resume
- SQL query history and account usage views
- simple native alerts tied to usage thresholds
-
Databricks is stronger for:
- Spark job tracking
- stage and task-level signals
- streaming backlog and listener-based telemetry
- cluster and pipeline watch across more workload types
This comparison looks at 6 day-to-day areas:
- compute monitoring
- query visibility
- alerts and notifications
- cost tracking
- jobs and streaming observability
- automated maintenance behavior
One big point stands out: both platforms are usage-based, but they show usage in different ways. Snowflake centers on credits. Databricks centers on DBUs. So if you care about keeping monthly spend under control, visibility into where usage comes from matters just as much as raw cost.
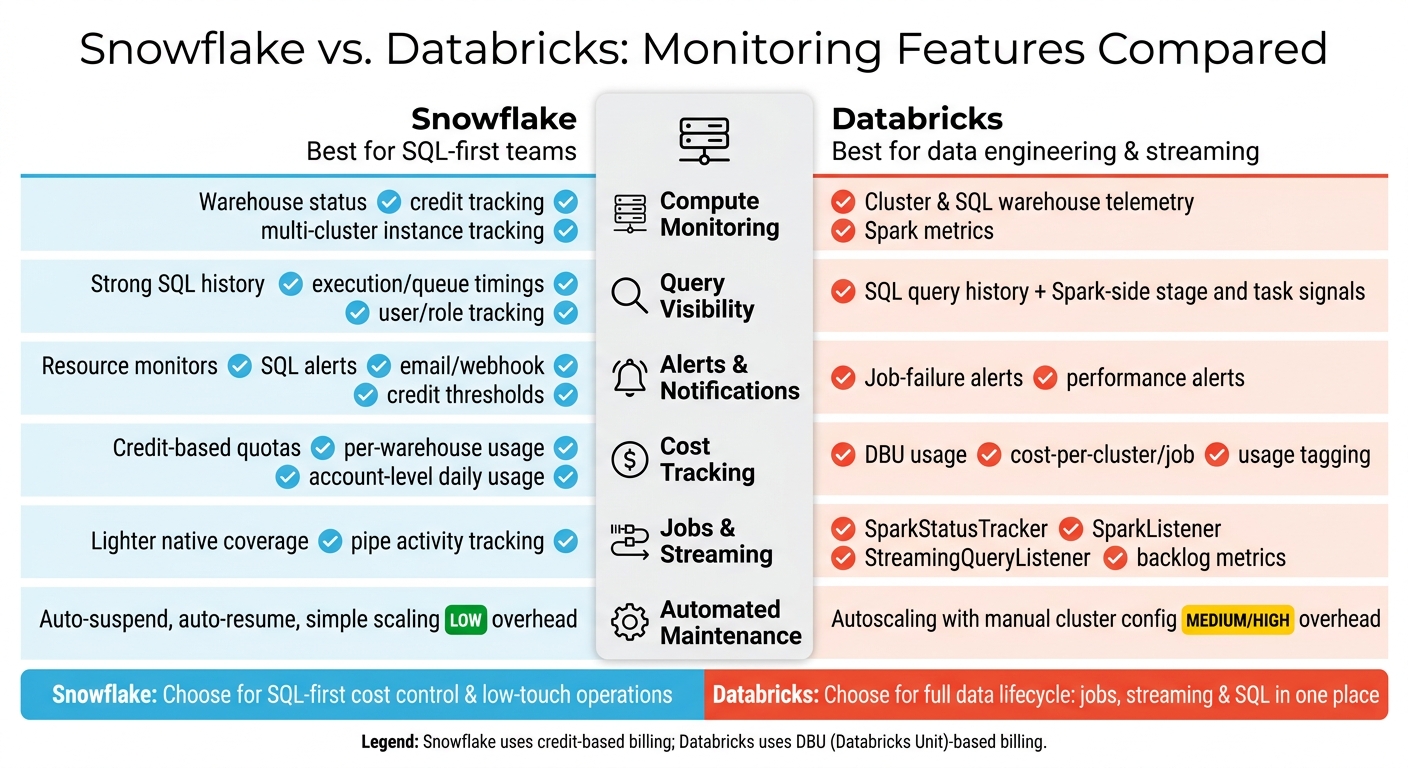
Snowflake vs. Databricks: Monitoring Features Compared
Quick Comparison
| Area | Snowflake | Databricks |
|---|---|---|
| Compute monitoring | Warehouse status, usage, credit tracking | Cluster and SQL warehouse telemetry |
| Query visibility | Strong SQL history and timing views | SQL query history plus Spark-side signals |
| Alerts | Resource monitors, SQL alerts, email/webhook | Job and performance alerts |
| Cost tracking | Native credit quotas and account usage | DBU usage, tags, cluster/job cost views |
| Jobs & streaming | Lighter native coverage | Stronger Spark job and streaming watch |
| Automated maintenance | Auto-suspend, auto-resume, scaling controls | Autoscaling with more cluster setup work |
My takeaway is simple: Snowflake keeps monitoring easier for SQL-first teams, while Databricks gives you more depth for data engineering and streaming-heavy setups. The rest of the article breaks down where each one fits best.
Snowflake Monitoring and Automated Maintenance
Snowflake’s native monitoring stack centers on Resource Monitors, the ACCOUNT_USAGE schema, and Snowsight Alerts. Together, these controls help you keep an eye on spend, usage history, storage, and failure response.
Resource Monitors, ACCOUNT_USAGE, and Query Visibility
Resource Monitors are Snowflake’s built-in spend controls. You can set a credit quota at either the account or warehouse level, then choose what happens when usage hits certain thresholds. The available actions are Notify, Suspend, and Suspend Immediately. A common setup is simple: warn at 80% and suspend at 100%.
ACCOUNT_USAGE gives you the visibility to go past raw spend numbers. QUERY_HISTORY helps with performance analysis, TASK_HISTORY shows what happened during automated workload runs, and storage metrics break usage into active, Time Travel, and Failsafe bytes.
That handles cost control. Alerts handle what happens next.
Snowflake Alerts, Notifications, and Telemetry
Snowflake Alerts evaluate SQL conditions on a schedule and fire when there’s a match. You can run them every 10 minutes or trigger them when new events appear, like fresh rows landing in a monitored table.
Snowsight also includes templates for:
- Data quality
- Task error rates
- Openflow monitoring
- Sustained high CPU usage
- Connector backpressure
Notifications can be sent by email or webhook. If you want failure details in the event table, set LOG_LEVEL to ERROR.
For deeper troubleshooting, Snowflake logs the failure details too.
Auto-Suspend, Auto-Resume, and Optimization Features
To cut idle spend, Snowflake can shut down and restart warehouses on its own. When a warehouse is inactive, it stops consuming credits and resumes on demand. Paired with Resource Monitors, this gives you a simple two-layer control: one layer for routine idle time, another for usage spikes that come out of nowhere.
On the performance side, snowflake_warehouse_blocked_queries helps you spot resource contention. If that number keeps showing up, it may be a sign that warehouse size or autoscaling settings need a closer look. And if you want to see where credits are going, snowflake_used_compute_credits and snowflake_used_cloud_services_credits show where spend builds up.
Databricks Monitoring and Automated Maintenance
Databricks uses Spark-native metrics and workspace APIs to show job, cluster, and streaming activity. That gives teams a clear view of job progress, scheduler events, and resource health.
SQL Warehouse and Cluster Monitoring
Databricks exposes runtime metrics for SQL warehouses and clusters through Spark telemetry. Teams can use that data to watch utilization, performance, and overall resource health.
Jobs, Notifications, and Streaming Backlog Metrics
For day-to-day visibility, Databricks tracks jobs and streaming activity directly through Spark listeners. This cuts down on manual checks and makes it easier to spot issues as they happen.
SparkStatusTrackertracks job, stage, and task progress.SparkListenerrecords failures and retries.StreamingQueryListenerexposes streaming events without custom polling.
Autoscaling and Lakehouse Observability Patterns
For custom metrics, Databricks supports application-specific instrumentation and export to native sinks or external observability tools such as Prometheus. Autoscaling also cuts down on manual tuning by adjusting cluster resources on the fly, which helps workloads stay responsive without operator input.
Next, compare how these monitoring surfaces differ in coverage, automation, and day-to-day overhead.
sbb-itb-61a6e59
Snowflake vs. Databricks: Side-by-Side Monitoring Comparison
Native Monitoring Coverage: Warehouses, Queries, Jobs, and Streaming
Snowflake’s native monitoring leans heavily toward SQL workloads. Databricks covers much of the same compute ground, but it goes further into jobs and streaming.
The big split isn’t whether these platforms show activity. They both do. The split is how much hands-on work it takes to turn that visibility into day-to-day operations.
| Monitoring Dimension | Snowflake | Databricks |
|---|---|---|
| Warehouse / Compute | Status, active query counts, multi-cluster instance tracking, and credit usage | SQL Warehouse monitoring and cluster health metrics |
| Query History | Execution/queue timings, query text, user/role tracking, and result status | Query history and execution plans within SQL warehouses |
| Streaming / Ingestion | Pipe activity, files/data inserted, and pipe-specific error tracking | Streaming backlog metrics and Spark UI |
| Cost Visibility | Credit usage by warehouse, account-level daily usage, and resource monitor quotas | Usage tagging and cost-per-cluster/job tracking |
| Storage / Lifecycle Visibility | Table size, failsafe, and Time Travel usage | Table and lifecycle visibility |
| Alerting & Automation | Credit thresholds and resource actions | Job-failure and performance alerts |
Coverage alone doesn’t tell the full story. In practice, lock contention and upkeep are where the gap starts to show.
Snowflake’s Blocked TRX monitoring helps teams spot lock contention and see which queries are involved, with up to three hours of history.
And once you get past feature coverage, the next issue is pretty simple: how much work lands on the operator.
Alerting, Automation, and Day-to-Day Overhead
Snowflake’s fully managed design keeps day-to-day overhead low. Databricks gives teams more cluster-level control, but that also means more upkeep. More knobs to turn usually means more time spent tuning and checking things.
| Platform | Strengths | Limitations | Maintenance Effort |
|---|---|---|---|
| Snowflake | Low overhead; automated scaling; built-in observability | Cost unpredictability; limited low-level engine tuning | Low - lower operational overhead |
| Databricks | Broad workload monitoring; granular compute and indexing control | Higher complexity; requires more manual cluster configuration | Medium/High - active Spark cluster management required |
For many teams, that tradeoff is the whole game. Snowflake asks less from operators. Databricks gives more control, but you pay for it in setup, tuning, and cluster management.
Which Platform Fits Common Monitoring Priorities
Choose Snowflake for SQL-first cost control. Choose Databricks for jobs and streaming.
Snowflake makes more sense for SQL-first analytics teams that want clear cost visibility, simple alerting, and low infrastructure overhead. Its credit-based Resource Monitors and per-second billing can make budget tracking easier to manage.
Databricks fits better when monitoring needs stretch past SQL warehouses and into jobs and streaming workloads. If that broader scope matters to your team, the extra operational complexity may be a fair trade.
Practical Takeaways and Conclusion
A Simple Evaluation Checklist
Use these questions to turn the feature comparison into an operating decision.
- Spend control: Can the platform cap spend or trigger alerts at credit or dollar thresholds?
- Alerting needs: Do you need native notifications for failed queries, background jobs, or both?
- Query visibility: Is centralized query visibility enough, or do you need stage-level metrics?
- Job reliability: Do your job chains need retry-aware monitoring?
- Streaming support: Does your pipeline need real-time backlog metrics for continuous ingestion?
- Configuration overhead: Can your team handle cluster setup and upkeep, or do you need a lower-maintenance model?
The pattern should make the fit pretty clear.
Key Points to Remember
If your answers split the team between SQL-first visibility and broader pipeline observability, the decision is already starting to show itself.
Snowflake is the more straightforward pick for teams focused on SQL warehouses, cost controls, and low-touch upkeep. Its auto-suspend and auto-resume features, along with Resource Monitors, help keep day-to-day work lighter without asking for deep platform knowledge.
Databricks makes more sense when observability needs to cover the full data lifecycle - scheduled Spark jobs, streaming pipelines, and SQL warehouses in one place. That broader reach comes with more setup overhead, so team readiness matters.
The better fit comes down to workload scope and how much operational complexity your team can take on.
For teams that want hands-on practice before adopting either platform, DataExpert.io Academy offers training and capstone projects in Snowflake and Databricks.
FAQs
Which platform is easier to monitor day to day?
It comes down to what your team works on every day and how comfortable they are with the stack.
Snowflake is often easier for day-to-day monitoring. Its SQL-first setup feels familiar, and built-in tools like Snowsight, Performance Explorer, and resource monitors make it simpler to check usage, spot slowdowns, and keep an eye on spend.
Databricks gives you deeper, more granular monitoring through its Job Monitoring Dashboard and system tables. That said, it usually asks for more comfort with notebooks and Spark, which can make the learning curve a bit steeper for some teams.
Both platforms provide strong operational visibility.
How do credits and DBUs affect cost monitoring?
In Snowflake and Databricks, credits and DBUs are the main ways to track and manage compute costs, but they’re not the same thing.
Snowflake links credits to virtual warehouse size and runtime. That means cost control usually comes down to watching warehouse use closely. Resource Monitors make that easier by helping you track usage, set limits, and send alerts before spend gets out of hand.
Databricks works a bit differently. It charges DBUs based on workload type and cluster size. So instead of focusing on warehouse settings, teams often keep a close eye on job runtimes and cluster usage through system.billing to keep costs in check.
When does Databricks make more sense than Snowflake?
Databricks is often the better fit for engineering-heavy workloads, especially complex ETL pipelines, real-time streaming, and advanced machine learning.
Because it’s built on Spark and supports Python and Scala, teams get the fine-grained control they need for large-scale data processing. That matters when workloads get messy, fast-moving, or expensive to run.
Many organizations also use Databricks for compute-heavy jobs where cost matters, such as training custom AI models.